Immigrants from Somalia vs Laotian Unemployment Among Ages 45 to 54 years
COMPARE
Immigrants from Somalia
Laotian
Unemployment Among Ages 45 to 54 years
Unemployment Among Ages 45 to 54 years Comparison
Immigrants from Somalia
Laotians
4.9%
UNEMPLOYMENT AMONG AGES 45 TO 54 YEARS
0.1/ 100
METRIC RATING
265th/ 347
METRIC RANK
4.4%
UNEMPLOYMENT AMONG AGES 45 TO 54 YEARS
86.3/ 100
METRIC RATING
129th/ 347
METRIC RANK
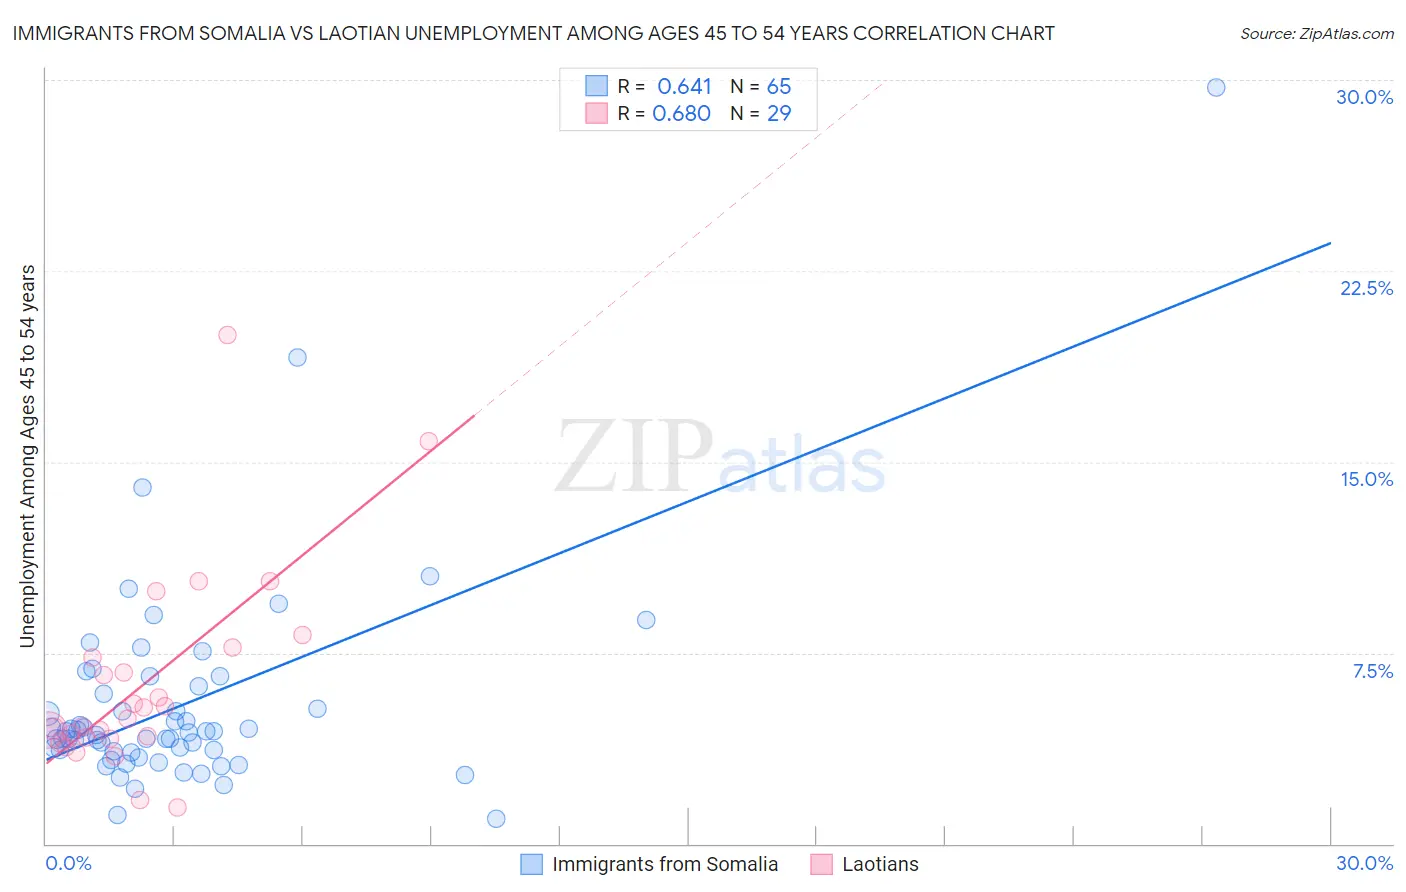
Immigrants from Somalia vs Laotian Unemployment Among Ages 45 to 54 years Correlation Chart
The statistical analysis conducted on geographies consisting of 91,437,404 people shows a significant positive correlation between the proportion of Immigrants from Somalia and unemployment rate among population between the ages 45 and 54 in the United States with a correlation coefficient (R) of 0.641 and weighted average of 4.9%. Similarly, the statistical analysis conducted on geographies consisting of 222,467,811 people shows a significant positive correlation between the proportion of Laotians and unemployment rate among population between the ages 45 and 54 in the United States with a correlation coefficient (R) of 0.680 and weighted average of 4.4%, a difference of 11.3%.
Unemployment Among Ages 45 to 54 years Correlation Summary
| Measurement | Immigrants from Somalia | Laotian |
| Minimum | 1.0% | 1.4% |
| Maximum | 29.7% | 20.0% |
| Range | 28.7% | 18.6% |
| Mean | 5.5% | 6.3% |
| Median | 4.4% | 4.9% |
| Interquartile 25% (IQ1) | 3.6% | 4.1% |
| Interquartile 75% (IQ3) | 6.0% | 7.5% |
| Interquartile Range (IQR) | 2.4% | 3.4% |
| Standard Deviation (Sample) | 4.2% | 4.0% |
| Standard Deviation (Population) | 4.2% | 3.9% |
Similar Demographics by Unemployment Among Ages 45 to 54 years
Demographics Similar to Immigrants from Somalia by Unemployment Among Ages 45 to 54 years
In terms of unemployment among ages 45 to 54 years, the demographic groups most similar to Immigrants from Somalia are Ghanaian (4.9%, a difference of 0.12%), Bahamian (4.9%, a difference of 0.21%), Immigrants from Guatemala (4.9%, a difference of 0.27%), Immigrants from Uzbekistan (4.9%, a difference of 0.30%), and Immigrants from Fiji (4.9%, a difference of 0.53%).
| Demographics | Rating | Rank | Unemployment Among Ages 45 to 54 years |
| Sub-Saharan Africans | 0.2 /100 | #258 | Tragic 4.9% |
| Ugandans | 0.1 /100 | #259 | Tragic 4.9% |
| Mexican American Indians | 0.1 /100 | #260 | Tragic 4.9% |
| Guatemalans | 0.1 /100 | #261 | Tragic 4.9% |
| Mexicans | 0.1 /100 | #262 | Tragic 4.9% |
| Immigrants | Fiji | 0.1 /100 | #263 | Tragic 4.9% |
| Immigrants | Guatemala | 0.1 /100 | #264 | Tragic 4.9% |
| Immigrants | Somalia | 0.1 /100 | #265 | Tragic 4.9% |
| Ghanaians | 0.0 /100 | #266 | Tragic 4.9% |
| Bahamians | 0.0 /100 | #267 | Tragic 4.9% |
| Immigrants | Uzbekistan | 0.0 /100 | #268 | Tragic 4.9% |
| Somalis | 0.0 /100 | #269 | Tragic 5.0% |
| Immigrants | Ghana | 0.0 /100 | #270 | Tragic 5.0% |
| Cajuns | 0.0 /100 | #271 | Tragic 5.0% |
| Immigrants | Central America | 0.0 /100 | #272 | Tragic 5.0% |
Demographics Similar to Laotians by Unemployment Among Ages 45 to 54 years
In terms of unemployment among ages 45 to 54 years, the demographic groups most similar to Laotians are Celtic (4.4%, a difference of 0.020%), Immigrants from Germany (4.4%, a difference of 0.040%), Immigrants from Northern Europe (4.4%, a difference of 0.060%), Immigrants from Eastern Africa (4.4%, a difference of 0.12%), and Nicaraguan (4.4%, a difference of 0.14%).
| Demographics | Rating | Rank | Unemployment Among Ages 45 to 54 years |
| Immigrants | Kazakhstan | 89.5 /100 | #122 | Excellent 4.4% |
| Immigrants | Asia | 88.8 /100 | #123 | Excellent 4.4% |
| Spanish | 88.8 /100 | #124 | Excellent 4.4% |
| Immigrants | Vietnam | 88.6 /100 | #125 | Excellent 4.4% |
| Immigrants | Czechoslovakia | 87.8 /100 | #126 | Excellent 4.4% |
| Nicaraguans | 87.6 /100 | #127 | Excellent 4.4% |
| Immigrants | Northern Europe | 86.9 /100 | #128 | Excellent 4.4% |
| Laotians | 86.3 /100 | #129 | Excellent 4.4% |
| Celtics | 86.2 /100 | #130 | Excellent 4.4% |
| Immigrants | Germany | 85.9 /100 | #131 | Excellent 4.4% |
| Immigrants | Eastern Africa | 85.1 /100 | #132 | Excellent 4.4% |
| Immigrants | Cameroon | 84.8 /100 | #133 | Excellent 4.4% |
| Afghans | 84.6 /100 | #134 | Excellent 4.4% |
| Immigrants | Eastern Asia | 84.0 /100 | #135 | Excellent 4.4% |
| Immigrants | Middle Africa | 83.3 /100 | #136 | Excellent 4.4% |