Immigrants from Singapore vs Immigrants from South Eastern Asia Unemployment Among Ages 65 to 74 years
COMPARE
Immigrants from Singapore
Immigrants from South Eastern Asia
Unemployment Among Ages 65 to 74 years
Unemployment Among Ages 65 to 74 years Comparison
Immigrants from Singapore
Immigrants from South Eastern Asia
5.2%
UNEMPLOYMENT AMONG AGES 65 TO 74 YEARS
93.9/ 100
METRIC RATING
109th/ 347
METRIC RANK
5.3%
UNEMPLOYMENT AMONG AGES 65 TO 74 YEARS
87.2/ 100
METRIC RATING
126th/ 347
METRIC RANK
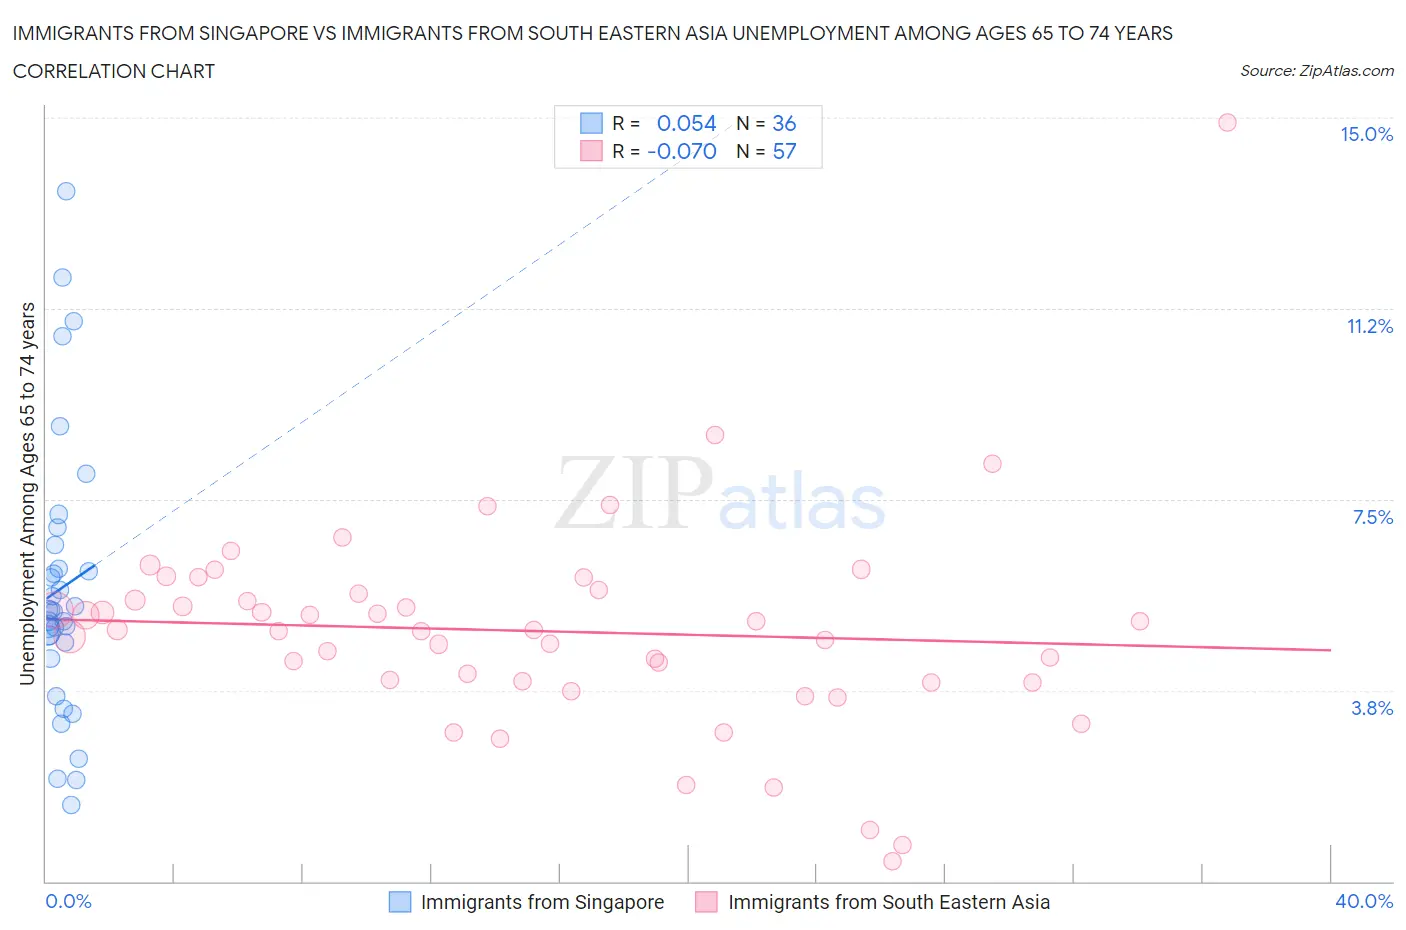
Immigrants from Singapore vs Immigrants from South Eastern Asia Unemployment Among Ages 65 to 74 years Correlation Chart
The statistical analysis conducted on geographies consisting of 131,671,706 people shows a slight positive correlation between the proportion of Immigrants from Singapore and unemployment rate among population between the ages 65 and 74 in the United States with a correlation coefficient (R) of 0.054 and weighted average of 5.2%. Similarly, the statistical analysis conducted on geographies consisting of 425,067,321 people shows a slight negative correlation between the proportion of Immigrants from South Eastern Asia and unemployment rate among population between the ages 65 and 74 in the United States with a correlation coefficient (R) of -0.070 and weighted average of 5.3%, a difference of 0.70%.
Unemployment Among Ages 65 to 74 years Correlation Summary
| Measurement | Immigrants from Singapore | Immigrants from South Eastern Asia |
| Minimum | 1.5% | 0.40% |
| Maximum | 13.6% | 14.9% |
| Range | 12.1% | 14.5% |
| Mean | 5.8% | 4.9% |
| Median | 5.3% | 4.9% |
| Interquartile 25% (IQ1) | 4.5% | 3.9% |
| Interquartile 75% (IQ3) | 6.4% | 5.7% |
| Interquartile Range (IQR) | 1.8% | 1.8% |
| Standard Deviation (Sample) | 2.7% | 2.1% |
| Standard Deviation (Population) | 2.7% | 2.1% |
Demographics Similar to Immigrants from Singapore and Immigrants from South Eastern Asia by Unemployment Among Ages 65 to 74 years
In terms of unemployment among ages 65 to 74 years, the demographic groups most similar to Immigrants from Singapore are Immigrants from Malaysia (5.2%, a difference of 0.030%), Immigrants from Bolivia (5.2%, a difference of 0.050%), Austrian (5.2%, a difference of 0.090%), Sri Lankan (5.3%, a difference of 0.16%), and Immigrants from South Central Asia (5.3%, a difference of 0.21%). Similarly, the demographic groups most similar to Immigrants from South Eastern Asia are Pakistani (5.3%, a difference of 0.020%), Immigrants from Ukraine (5.3%, a difference of 0.030%), Immigrants from North America (5.3%, a difference of 0.040%), Czechoslovakian (5.3%, a difference of 0.12%), and Immigrants from Canada (5.3%, a difference of 0.15%).
| Demographics | Rating | Rank | Unemployment Among Ages 65 to 74 years |
| Austrians | 94.5 /100 | #107 | Exceptional 5.2% |
| Immigrants | Malaysia | 94.1 /100 | #108 | Exceptional 5.2% |
| Immigrants | Singapore | 93.9 /100 | #109 | Exceptional 5.2% |
| Immigrants | Bolivia | 93.6 /100 | #110 | Exceptional 5.2% |
| Sri Lankans | 92.7 /100 | #111 | Exceptional 5.3% |
| Immigrants | South Central Asia | 92.4 /100 | #112 | Exceptional 5.3% |
| Immigrants | Germany | 91.6 /100 | #113 | Exceptional 5.3% |
| Asians | 91.1 /100 | #114 | Exceptional 5.3% |
| Immigrants | Turkey | 90.8 /100 | #115 | Exceptional 5.3% |
| Australians | 90.4 /100 | #116 | Exceptional 5.3% |
| Immigrants | Korea | 90.2 /100 | #117 | Exceptional 5.3% |
| Immigrants | Belarus | 90.1 /100 | #118 | Exceptional 5.3% |
| Immigrants | Fiji | 89.9 /100 | #119 | Excellent 5.3% |
| Immigrants | Switzerland | 89.9 /100 | #120 | Excellent 5.3% |
| Immigrants | Australia | 89.1 /100 | #121 | Excellent 5.3% |
| Immigrants | Canada | 89.0 /100 | #122 | Excellent 5.3% |
| Czechoslovakians | 88.6 /100 | #123 | Excellent 5.3% |
| Immigrants | Ukraine | 87.5 /100 | #124 | Excellent 5.3% |
| Pakistanis | 87.5 /100 | #125 | Excellent 5.3% |
| Immigrants | South Eastern Asia | 87.2 /100 | #126 | Excellent 5.3% |
| Immigrants | North America | 86.7 /100 | #127 | Excellent 5.3% |