Immigrants from Singapore vs Immigrants from Grenada Unemployment Among Ages 16 to 19 years
COMPARE
Immigrants from Singapore
Immigrants from Grenada
Unemployment Among Ages 16 to 19 years
Unemployment Among Ages 16 to 19 years Comparison
Immigrants from Singapore
Immigrants from Grenada
16.8%
UNEMPLOYMENT AMONG AGES 16 TO 19 YEARS
97.8/ 100
METRIC RATING
77th/ 347
METRIC RANK
25.7%
UNEMPLOYMENT AMONG AGES 16 TO 19 YEARS
0.0/ 100
METRIC RATING
339th/ 347
METRIC RANK
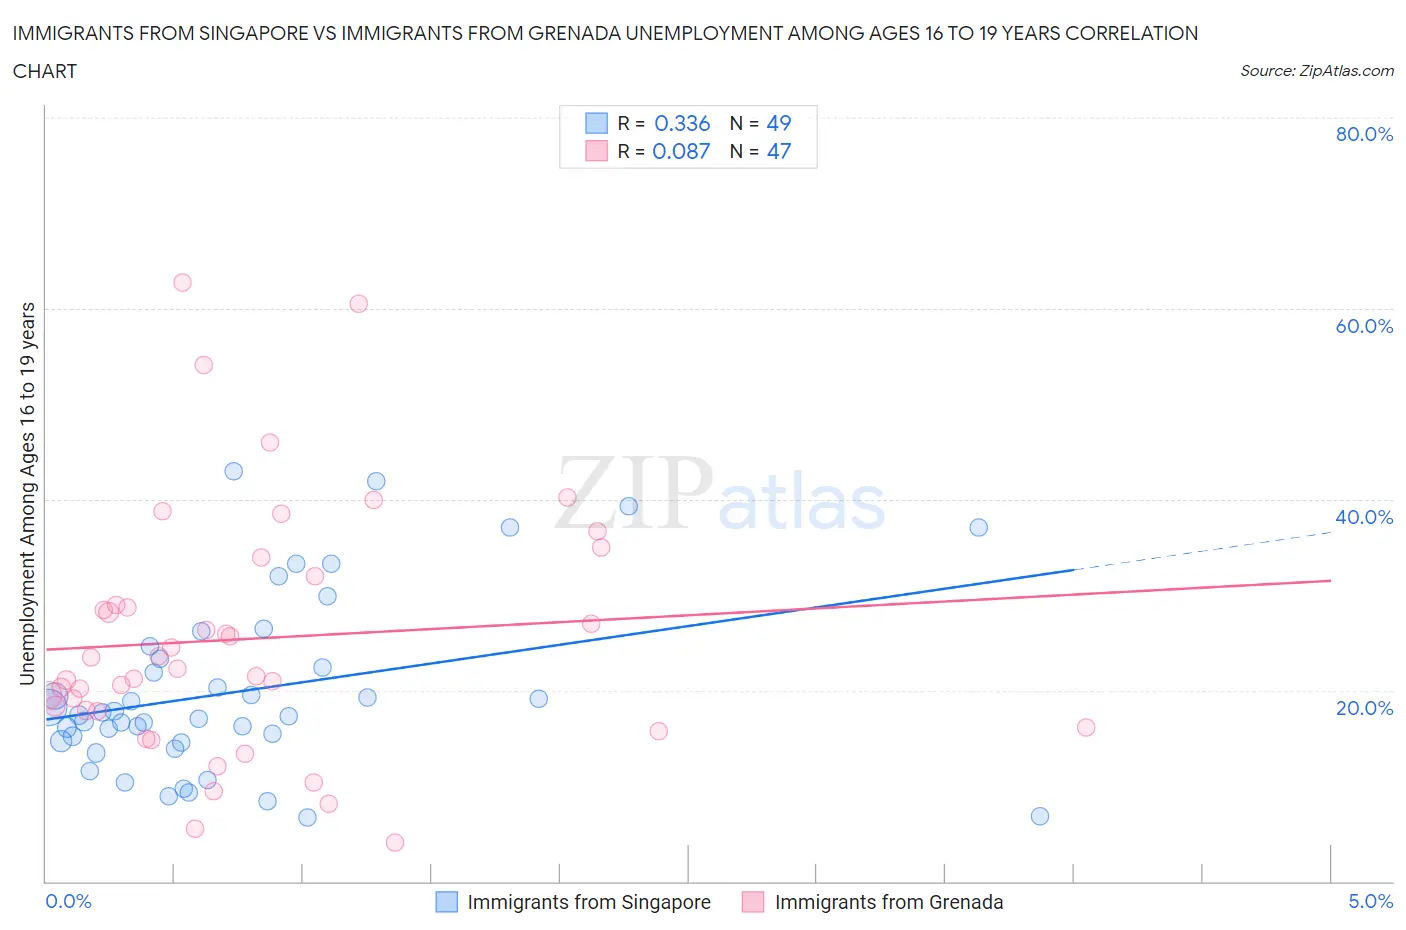
Immigrants from Singapore vs Immigrants from Grenada Unemployment Among Ages 16 to 19 years Correlation Chart
The statistical analysis conducted on geographies consisting of 134,451,520 people shows a mild positive correlation between the proportion of Immigrants from Singapore and unemployment rate among population between the ages 16 and 19 in the United States with a correlation coefficient (R) of 0.336 and weighted average of 16.8%. Similarly, the statistical analysis conducted on geographies consisting of 66,410,063 people shows a slight positive correlation between the proportion of Immigrants from Grenada and unemployment rate among population between the ages 16 and 19 in the United States with a correlation coefficient (R) of 0.087 and weighted average of 25.7%, a difference of 53.3%.
Unemployment Among Ages 16 to 19 years Correlation Summary
| Measurement | Immigrants from Singapore | Immigrants from Grenada |
| Minimum | 6.7% | 4.1% |
| Maximum | 43.0% | 62.7% |
| Range | 36.3% | 58.6% |
| Mean | 19.9% | 25.4% |
| Median | 17.4% | 22.3% |
| Interquartile 25% (IQ1) | 14.6% | 17.8% |
| Interquartile 75% (IQ3) | 24.0% | 32.0% |
| Interquartile Range (IQR) | 9.4% | 14.2% |
| Standard Deviation (Sample) | 9.2% | 13.0% |
| Standard Deviation (Population) | 9.1% | 12.9% |
Similar Demographics by Unemployment Among Ages 16 to 19 years
Demographics Similar to Immigrants from Singapore by Unemployment Among Ages 16 to 19 years
In terms of unemployment among ages 16 to 19 years, the demographic groups most similar to Immigrants from Singapore are Soviet Union (16.8%, a difference of 0.020%), Immigrants from North America (16.8%, a difference of 0.070%), New Zealander (16.8%, a difference of 0.14%), Slovak (16.8%, a difference of 0.17%), and French Canadian (16.8%, a difference of 0.17%).
| Demographics | Rating | Rank | Unemployment Among Ages 16 to 19 years |
| Austrians | 98.6 /100 | #70 | Exceptional 16.7% |
| Latvians | 98.5 /100 | #71 | Exceptional 16.7% |
| Immigrants | Canada | 98.5 /100 | #72 | Exceptional 16.7% |
| Lithuanians | 98.2 /100 | #73 | Exceptional 16.7% |
| Immigrants | Eastern Africa | 98.1 /100 | #74 | Exceptional 16.8% |
| New Zealanders | 98.0 /100 | #75 | Exceptional 16.8% |
| Immigrants | North America | 97.9 /100 | #76 | Exceptional 16.8% |
| Immigrants | Singapore | 97.8 /100 | #77 | Exceptional 16.8% |
| Soviet Union | 97.8 /100 | #78 | Exceptional 16.8% |
| Slovaks | 97.5 /100 | #79 | Exceptional 16.8% |
| French Canadians | 97.5 /100 | #80 | Exceptional 16.8% |
| Immigrants | Latvia | 97.5 /100 | #81 | Exceptional 16.8% |
| Whites/Caucasians | 97.5 /100 | #82 | Exceptional 16.8% |
| Ugandans | 97.4 /100 | #83 | Exceptional 16.8% |
| French | 97.4 /100 | #84 | Exceptional 16.8% |
Demographics Similar to Immigrants from Grenada by Unemployment Among Ages 16 to 19 years
In terms of unemployment among ages 16 to 19 years, the demographic groups most similar to Immigrants from Grenada are Immigrants from St. Vincent and the Grenadines (25.7%, a difference of 0.19%), Immigrants from Guyana (25.5%, a difference of 1.0%), Crow (26.2%, a difference of 1.9%), Kiowa (25.2%, a difference of 2.1%), and Arapaho (25.2%, a difference of 2.3%).
| Demographics | Rating | Rank | Unemployment Among Ages 16 to 19 years |
| Immigrants | Barbados | 0.0 /100 | #332 | Tragic 24.0% |
| Paiute | 0.0 /100 | #333 | Tragic 24.4% |
| Guyanese | 0.0 /100 | #334 | Tragic 24.8% |
| Arapaho | 0.0 /100 | #335 | Tragic 25.2% |
| Kiowa | 0.0 /100 | #336 | Tragic 25.2% |
| Immigrants | Guyana | 0.0 /100 | #337 | Tragic 25.5% |
| Immigrants | St. Vincent and the Grenadines | 0.0 /100 | #338 | Tragic 25.7% |
| Immigrants | Grenada | 0.0 /100 | #339 | Tragic 25.7% |
| Crow | 0.0 /100 | #340 | Tragic 26.2% |
| Puerto Ricans | 0.0 /100 | #341 | Tragic 27.5% |
| Inupiat | 0.0 /100 | #342 | Tragic 28.1% |
| Navajo | 0.0 /100 | #343 | Tragic 29.0% |
| Colville | 0.0 /100 | #344 | Tragic 29.7% |
| Hopi | 0.0 /100 | #345 | Tragic 30.7% |
| Yuman | 0.0 /100 | #346 | Tragic 37.4% |