Immigrants from Sierra Leone vs Immigrants from Kuwait Unemployment Among Seniors over 65 years
COMPARE
Immigrants from Sierra Leone
Immigrants from Kuwait
Unemployment Among Seniors over 65 years
Unemployment Among Seniors over 65 years Comparison
Immigrants from Sierra Leone
Immigrants from Kuwait
5.4%
UNEMPLOYMENT AMONG SENIORS OVER 65 YEARS
0.6/ 100
METRIC RATING
253rd/ 347
METRIC RANK
4.8%
UNEMPLOYMENT AMONG SENIORS OVER 65 YEARS
100.0/ 100
METRIC RATING
35th/ 347
METRIC RANK
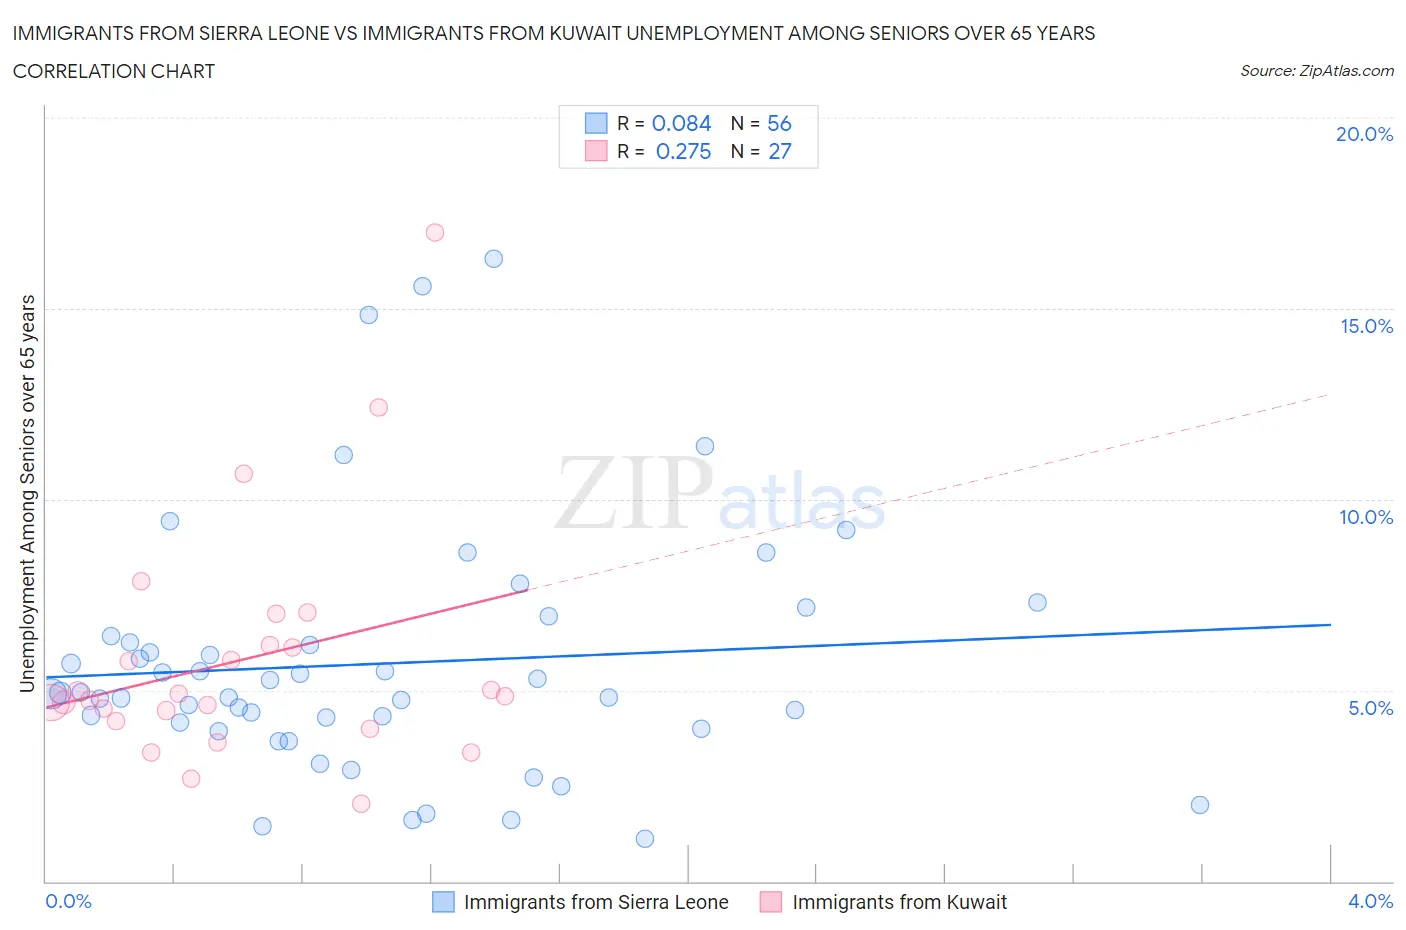
Immigrants from Sierra Leone vs Immigrants from Kuwait Unemployment Among Seniors over 65 years Correlation Chart
The statistical analysis conducted on geographies consisting of 98,618,169 people shows a slight positive correlation between the proportion of Immigrants from Sierra Leone and unemployment rate amomg seniors over the age of 65 in the United States with a correlation coefficient (R) of 0.084 and weighted average of 5.4%. Similarly, the statistical analysis conducted on geographies consisting of 132,651,314 people shows a weak positive correlation between the proportion of Immigrants from Kuwait and unemployment rate amomg seniors over the age of 65 in the United States with a correlation coefficient (R) of 0.275 and weighted average of 4.8%, a difference of 11.0%.
Unemployment Among Seniors over 65 years Correlation Summary
| Measurement | Immigrants from Sierra Leone | Immigrants from Kuwait |
| Minimum | 1.1% | 2.0% |
| Maximum | 16.3% | 17.0% |
| Range | 15.2% | 15.0% |
| Mean | 5.7% | 5.8% |
| Median | 4.9% | 4.9% |
| Interquartile 25% (IQ1) | 4.1% | 4.2% |
| Interquartile 75% (IQ3) | 6.3% | 6.2% |
| Interquartile Range (IQR) | 2.2% | 2.0% |
| Standard Deviation (Sample) | 3.2% | 3.1% |
| Standard Deviation (Population) | 3.2% | 3.1% |
Similar Demographics by Unemployment Among Seniors over 65 years
Demographics Similar to Immigrants from Sierra Leone by Unemployment Among Seniors over 65 years
In terms of unemployment among seniors over 65 years, the demographic groups most similar to Immigrants from Sierra Leone are Trinidadian and Tobagonian (5.4%, a difference of 0.030%), Paraguayan (5.4%, a difference of 0.060%), Immigrants from Peru (5.4%, a difference of 0.070%), West Indian (5.4%, a difference of 0.090%), and Moroccan (5.4%, a difference of 0.090%).
| Demographics | Rating | Rank | Unemployment Among Seniors over 65 years |
| Colombians | 0.7 /100 | #246 | Tragic 5.3% |
| Immigrants | Caribbean | 0.7 /100 | #247 | Tragic 5.3% |
| French Canadians | 0.7 /100 | #248 | Tragic 5.4% |
| Immigrants | Immigrants | 0.6 /100 | #249 | Tragic 5.4% |
| Ghanaians | 0.6 /100 | #250 | Tragic 5.4% |
| West Indians | 0.6 /100 | #251 | Tragic 5.4% |
| Trinidadians and Tobagonians | 0.6 /100 | #252 | Tragic 5.4% |
| Immigrants | Sierra Leone | 0.6 /100 | #253 | Tragic 5.4% |
| Paraguayans | 0.5 /100 | #254 | Tragic 5.4% |
| Immigrants | Peru | 0.5 /100 | #255 | Tragic 5.4% |
| Moroccans | 0.5 /100 | #256 | Tragic 5.4% |
| Immigrants | Micronesia | 0.4 /100 | #257 | Tragic 5.4% |
| Sierra Leoneans | 0.4 /100 | #258 | Tragic 5.4% |
| Immigrants | Ghana | 0.4 /100 | #259 | Tragic 5.4% |
| Native Hawaiians | 0.3 /100 | #260 | Tragic 5.4% |
Demographics Similar to Immigrants from Kuwait by Unemployment Among Seniors over 65 years
In terms of unemployment among seniors over 65 years, the demographic groups most similar to Immigrants from Kuwait are Bhutanese (4.8%, a difference of 0.020%), Cambodian (4.8%, a difference of 0.14%), Bulgarian (4.8%, a difference of 0.15%), Immigrants from India (4.8%, a difference of 0.21%), and Macedonian (4.8%, a difference of 0.24%).
| Demographics | Rating | Rank | Unemployment Among Seniors over 65 years |
| Ugandans | 100.0 /100 | #28 | Exceptional 4.8% |
| Immigrants | North Macedonia | 100.0 /100 | #29 | Exceptional 4.8% |
| Belgians | 100.0 /100 | #30 | Exceptional 4.8% |
| Immigrants | Uganda | 100.0 /100 | #31 | Exceptional 4.8% |
| Slovenes | 100.0 /100 | #32 | Exceptional 4.8% |
| Palestinians | 100.0 /100 | #33 | Exceptional 4.8% |
| Bhutanese | 100.0 /100 | #34 | Exceptional 4.8% |
| Immigrants | Kuwait | 100.0 /100 | #35 | Exceptional 4.8% |
| Cambodians | 100.0 /100 | #36 | Exceptional 4.8% |
| Bulgarians | 99.9 /100 | #37 | Exceptional 4.8% |
| Immigrants | India | 99.9 /100 | #38 | Exceptional 4.8% |
| Macedonians | 99.9 /100 | #39 | Exceptional 4.8% |
| Immigrants | Sweden | 99.9 /100 | #40 | Exceptional 4.8% |
| Kiowa | 99.9 /100 | #41 | Exceptional 4.8% |
| Swiss | 99.9 /100 | #42 | Exceptional 4.8% |