Immigrants from Sierra Leone vs Immigrants from India Unemployment Among Seniors over 75 years
COMPARE
Immigrants from Sierra Leone
Immigrants from India
Unemployment Among Seniors over 75 years
Unemployment Among Seniors over 75 years Comparison
Immigrants from Sierra Leone
Immigrants from India
8.5%
UNEMPLOYMENT AMONG SENIORS OVER 75 YEARS
85.6/ 100
METRIC RATING
147th/ 347
METRIC RANK
8.2%
UNEMPLOYMENT AMONG SENIORS OVER 75 YEARS
98.6/ 100
METRIC RATING
112th/ 347
METRIC RANK
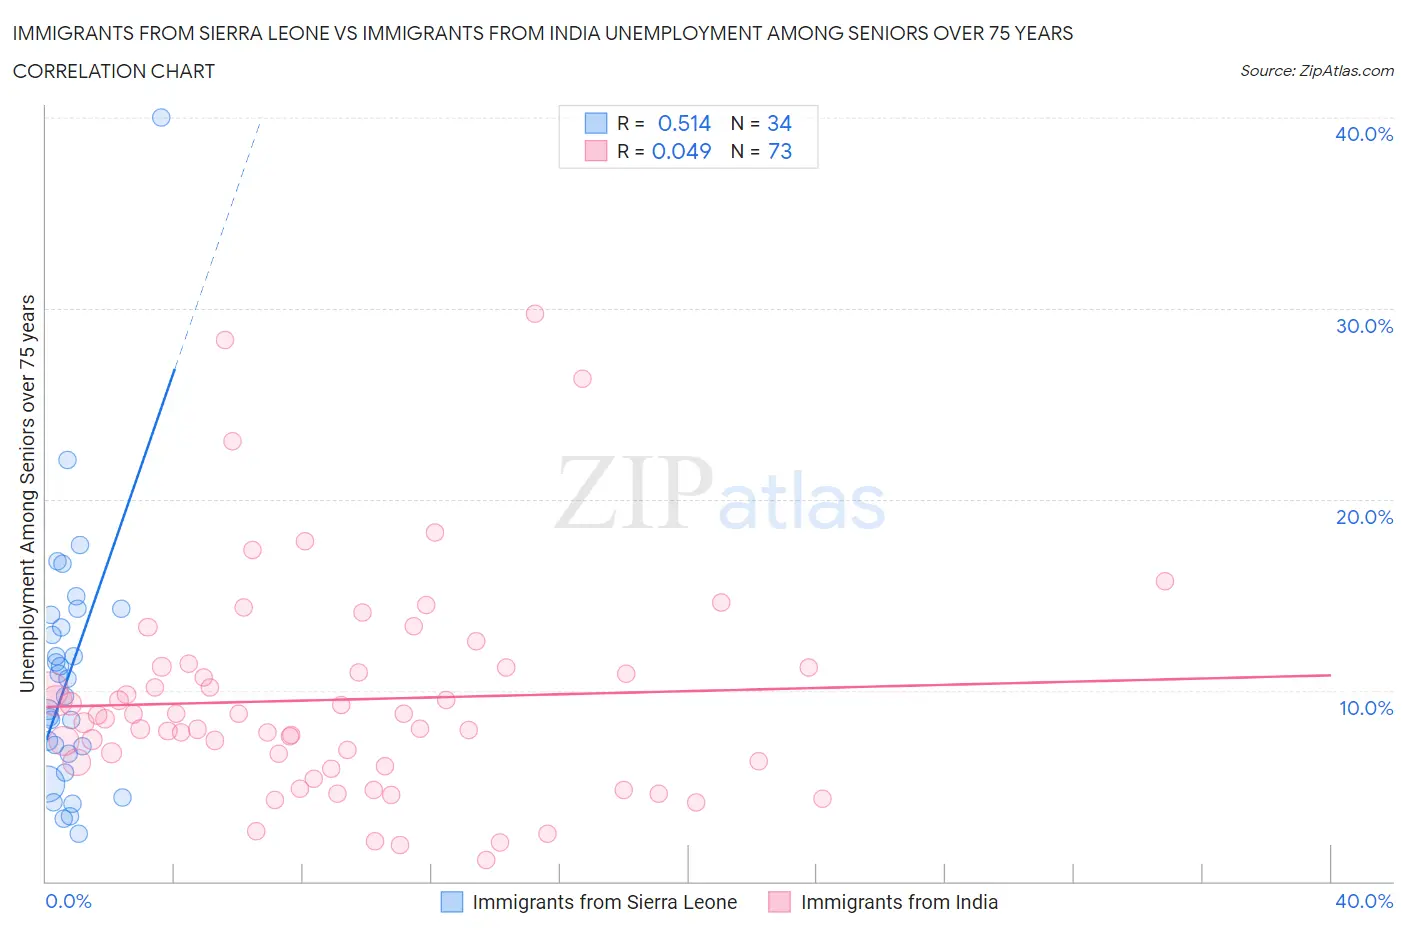
Immigrants from Sierra Leone vs Immigrants from India Unemployment Among Seniors over 75 years Correlation Chart
The statistical analysis conducted on geographies consisting of 73,581,651 people shows a substantial positive correlation between the proportion of Immigrants from Sierra Leone and unemployment rate among seniors over the age of 75 in the United States with a correlation coefficient (R) of 0.514 and weighted average of 8.5%. Similarly, the statistical analysis conducted on geographies consisting of 212,990,151 people shows no correlation between the proportion of Immigrants from India and unemployment rate among seniors over the age of 75 in the United States with a correlation coefficient (R) of 0.049 and weighted average of 8.2%, a difference of 3.5%.
Unemployment Among Seniors over 75 years Correlation Summary
| Measurement | Immigrants from Sierra Leone | Immigrants from India |
| Minimum | 2.5% | 1.1% |
| Maximum | 40.0% | 29.7% |
| Range | 37.5% | 28.6% |
| Mean | 10.9% | 9.5% |
| Median | 10.1% | 8.5% |
| Interquartile 25% (IQ1) | 6.7% | 6.1% |
| Interquartile 75% (IQ3) | 14.0% | 11.2% |
| Interquartile Range (IQR) | 7.3% | 5.1% |
| Standard Deviation (Sample) | 7.0% | 5.7% |
| Standard Deviation (Population) | 6.9% | 5.6% |
Similar Demographics by Unemployment Among Seniors over 75 years
Demographics Similar to Immigrants from Sierra Leone by Unemployment Among Seniors over 75 years
In terms of unemployment among seniors over 75 years, the demographic groups most similar to Immigrants from Sierra Leone are Immigrants from Colombia (8.5%, a difference of 0.0%), Immigrants from South Eastern Asia (8.5%, a difference of 0.020%), Immigrants from Romania (8.5%, a difference of 0.070%), Immigrants from Ecuador (8.5%, a difference of 0.11%), and Colombian (8.5%, a difference of 0.13%).
| Demographics | Rating | Rank | Unemployment Among Seniors over 75 years |
| South Americans | 87.9 /100 | #140 | Excellent 8.5% |
| Immigrants | Bolivia | 87.9 /100 | #141 | Excellent 8.5% |
| Immigrants | Ukraine | 87.0 /100 | #142 | Excellent 8.5% |
| Immigrants | Costa Rica | 86.8 /100 | #143 | Excellent 8.5% |
| Colombians | 86.7 /100 | #144 | Excellent 8.5% |
| Immigrants | Romania | 86.2 /100 | #145 | Excellent 8.5% |
| Immigrants | South Eastern Asia | 85.8 /100 | #146 | Excellent 8.5% |
| Immigrants | Sierra Leone | 85.6 /100 | #147 | Excellent 8.5% |
| Immigrants | Colombia | 85.6 /100 | #148 | Excellent 8.5% |
| Immigrants | Ecuador | 84.6 /100 | #149 | Excellent 8.5% |
| Paiute | 82.5 /100 | #150 | Excellent 8.6% |
| Immigrants | Bosnia and Herzegovina | 80.6 /100 | #151 | Excellent 8.6% |
| Latvians | 80.5 /100 | #152 | Excellent 8.6% |
| Mongolians | 80.1 /100 | #153 | Excellent 8.6% |
| Immigrants | Pakistan | 79.7 /100 | #154 | Good 8.6% |
Demographics Similar to Immigrants from India by Unemployment Among Seniors over 75 years
In terms of unemployment among seniors over 75 years, the demographic groups most similar to Immigrants from India are Asian (8.3%, a difference of 0.060%), French American Indian (8.2%, a difference of 0.13%), Marshallese (8.2%, a difference of 0.17%), Immigrants from Lebanon (8.2%, a difference of 0.20%), and Trinidadian and Tobagonian (8.3%, a difference of 0.21%).
| Demographics | Rating | Rank | Unemployment Among Seniors over 75 years |
| Immigrants | Caribbean | 99.0 /100 | #105 | Exceptional 8.2% |
| Immigrants | Honduras | 99.0 /100 | #106 | Exceptional 8.2% |
| Sri Lankans | 98.9 /100 | #107 | Exceptional 8.2% |
| Laotians | 98.8 /100 | #108 | Exceptional 8.2% |
| Immigrants | Lebanon | 98.8 /100 | #109 | Exceptional 8.2% |
| Marshallese | 98.7 /100 | #110 | Exceptional 8.2% |
| French American Indians | 98.7 /100 | #111 | Exceptional 8.2% |
| Immigrants | India | 98.6 /100 | #112 | Exceptional 8.2% |
| Asians | 98.5 /100 | #113 | Exceptional 8.3% |
| Trinidadians and Tobagonians | 98.4 /100 | #114 | Exceptional 8.3% |
| Sudanese | 98.2 /100 | #115 | Exceptional 8.3% |
| Immigrants | West Indies | 98.1 /100 | #116 | Exceptional 8.3% |
| Immigrants | Greece | 97.9 /100 | #117 | Exceptional 8.3% |
| Immigrants | Middle Africa | 97.9 /100 | #118 | Exceptional 8.3% |
| Japanese | 97.5 /100 | #119 | Exceptional 8.3% |