Immigrants from Senegal vs Immigrants from Pakistan Unemployment Among Ages 60 to 64 years
COMPARE
Immigrants from Senegal
Immigrants from Pakistan
Unemployment Among Ages 60 to 64 years
Unemployment Among Ages 60 to 64 years Comparison
Immigrants from Senegal
Immigrants from Pakistan
4.7%
UNEMPLOYMENT AMONG AGES 60 TO 64 YEARS
94.5/ 100
METRIC RATING
124th/ 347
METRIC RANK
4.8%
UNEMPLOYMENT AMONG AGES 60 TO 64 YEARS
83.3/ 100
METRIC RATING
144th/ 347
METRIC RANK
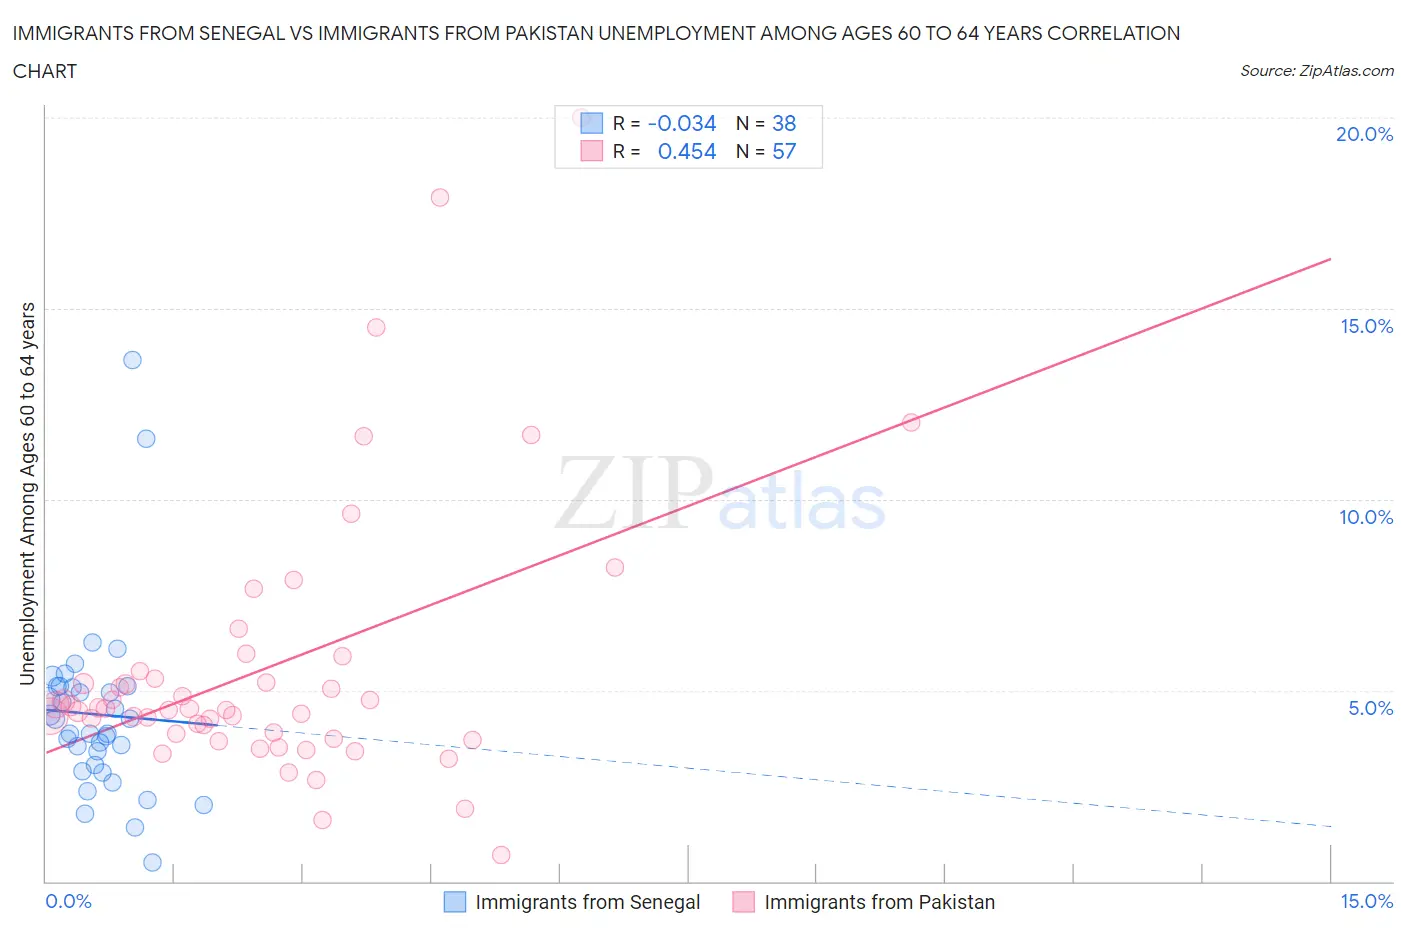
Immigrants from Senegal vs Immigrants from Pakistan Unemployment Among Ages 60 to 64 years Correlation Chart
The statistical analysis conducted on geographies consisting of 87,745,188 people shows no correlation between the proportion of Immigrants from Senegal and unemployment rate among population between the ages 60 and 64 in the United States with a correlation coefficient (R) of -0.034 and weighted average of 4.7%. Similarly, the statistical analysis conducted on geographies consisting of 267,638,275 people shows a moderate positive correlation between the proportion of Immigrants from Pakistan and unemployment rate among population between the ages 60 and 64 in the United States with a correlation coefficient (R) of 0.454 and weighted average of 4.8%, a difference of 1.1%.
Unemployment Among Ages 60 to 64 years Correlation Summary
| Measurement | Immigrants from Senegal | Immigrants from Pakistan |
| Minimum | 0.50% | 0.70% |
| Maximum | 13.7% | 20.0% |
| Range | 13.2% | 19.3% |
| Mean | 4.4% | 5.6% |
| Median | 4.1% | 4.5% |
| Interquartile 25% (IQ1) | 3.1% | 3.8% |
| Interquartile 75% (IQ3) | 5.1% | 5.4% |
| Interquartile Range (IQR) | 2.0% | 1.6% |
| Standard Deviation (Sample) | 2.4% | 3.6% |
| Standard Deviation (Population) | 2.4% | 3.6% |
Demographics Similar to Immigrants from Senegal and Immigrants from Pakistan by Unemployment Among Ages 60 to 64 years
In terms of unemployment among ages 60 to 64 years, the demographic groups most similar to Immigrants from Senegal are Immigrants from Thailand (4.7%, a difference of 0.14%), Immigrants from South Central Asia (4.7%, a difference of 0.24%), Austrian (4.8%, a difference of 0.38%), Choctaw (4.8%, a difference of 0.56%), and Immigrants from Serbia (4.8%, a difference of 0.57%). Similarly, the demographic groups most similar to Immigrants from Pakistan are Italian (4.8%, a difference of 0.11%), Immigrants from Ethiopia (4.8%, a difference of 0.14%), Panamanian (4.8%, a difference of 0.15%), Pima (4.8%, a difference of 0.17%), and Immigrants from Lithuania (4.8%, a difference of 0.24%).
| Demographics | Rating | Rank | Unemployment Among Ages 60 to 64 years |
| Immigrants | Senegal | 94.5 /100 | #124 | Exceptional 4.7% |
| Immigrants | Thailand | 93.7 /100 | #125 | Exceptional 4.7% |
| Immigrants | South Central Asia | 93.0 /100 | #126 | Exceptional 4.7% |
| Austrians | 91.9 /100 | #127 | Exceptional 4.8% |
| Choctaw | 90.3 /100 | #128 | Exceptional 4.8% |
| Immigrants | Serbia | 90.2 /100 | #129 | Exceptional 4.8% |
| Immigrants | Syria | 90.1 /100 | #130 | Exceptional 4.8% |
| Immigrants | Lebanon | 89.6 /100 | #131 | Excellent 4.8% |
| Lithuanians | 89.6 /100 | #132 | Excellent 4.8% |
| Yaqui | 89.5 /100 | #133 | Excellent 4.8% |
| Basques | 88.8 /100 | #134 | Excellent 4.8% |
| Pennsylvania Germans | 87.8 /100 | #135 | Excellent 4.8% |
| French Canadians | 87.6 /100 | #136 | Excellent 4.8% |
| Cambodians | 86.9 /100 | #137 | Excellent 4.8% |
| Immigrants | Lithuania | 86.7 /100 | #138 | Excellent 4.8% |
| Immigrants | Africa | 86.6 /100 | #139 | Excellent 4.8% |
| Pima | 85.8 /100 | #140 | Excellent 4.8% |
| Panamanians | 85.5 /100 | #141 | Excellent 4.8% |
| Immigrants | Ethiopia | 85.3 /100 | #142 | Excellent 4.8% |
| Italians | 85.0 /100 | #143 | Excellent 4.8% |
| Immigrants | Pakistan | 83.3 /100 | #144 | Excellent 4.8% |