Immigrants from Scotland vs Slovene Unemployment Among Seniors over 75 years
COMPARE
Immigrants from Scotland
Slovene
Unemployment Among Seniors over 75 years
Unemployment Among Seniors over 75 years Comparison
Immigrants from Scotland
Slovenes
9.2%
UNEMPLOYMENT AMONG SENIORS OVER 75 YEARS
1.4/ 100
METRIC RATING
255th/ 347
METRIC RANK
9.3%
UNEMPLOYMENT AMONG SENIORS OVER 75 YEARS
1.0/ 100
METRIC RATING
259th/ 347
METRIC RANK
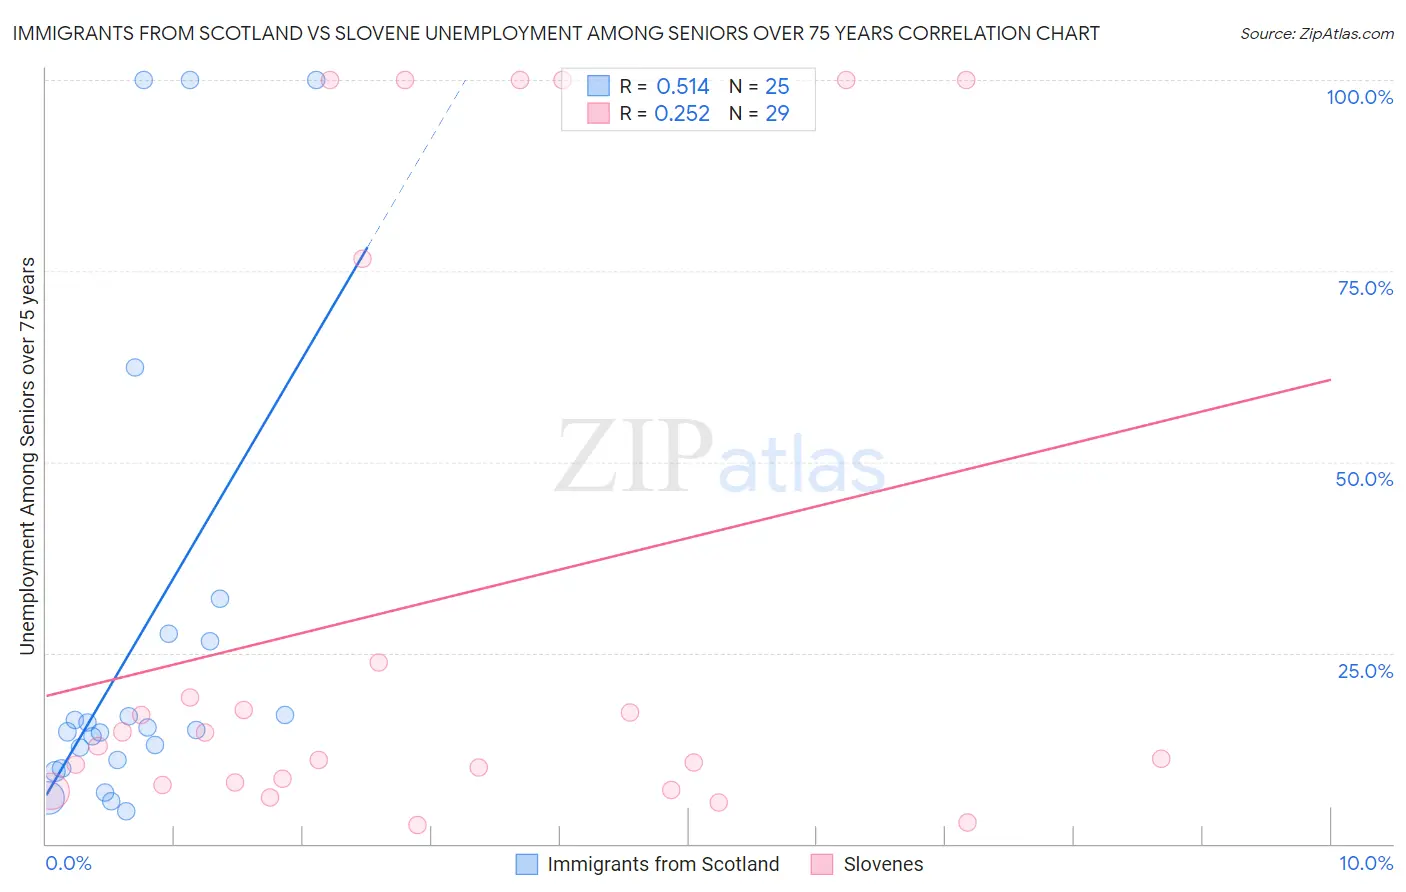
Immigrants from Scotland vs Slovene Unemployment Among Seniors over 75 years Correlation Chart
The statistical analysis conducted on geographies consisting of 127,951,152 people shows a substantial positive correlation between the proportion of Immigrants from Scotland and unemployment rate among seniors over the age of 75 in the United States with a correlation coefficient (R) of 0.514 and weighted average of 9.2%. Similarly, the statistical analysis conducted on geographies consisting of 150,124,678 people shows a weak positive correlation between the proportion of Slovenes and unemployment rate among seniors over the age of 75 in the United States with a correlation coefficient (R) of 0.252 and weighted average of 9.3%, a difference of 0.43%.
Unemployment Among Seniors over 75 years Correlation Summary
| Measurement | Immigrants from Scotland | Slovene |
| Minimum | 4.2% | 2.5% |
| Maximum | 100.0% | 100.0% |
| Range | 95.8% | 97.5% |
| Mean | 26.6% | 31.8% |
| Median | 14.9% | 12.7% |
| Interquartile 25% (IQ1) | 10.4% | 7.9% |
| Interquartile 75% (IQ3) | 27.0% | 50.2% |
| Interquartile Range (IQR) | 16.6% | 42.3% |
| Standard Deviation (Sample) | 30.0% | 37.8% |
| Standard Deviation (Population) | 29.4% | 37.1% |
Demographics Similar to Immigrants from Scotland and Slovenes by Unemployment Among Seniors over 75 years
In terms of unemployment among seniors over 75 years, the demographic groups most similar to Immigrants from Scotland are Brazilian (9.3%, a difference of 0.15%), Immigrants from Ghana (9.2%, a difference of 0.19%), Hawaiian (9.3%, a difference of 0.27%), Pima (9.2%, a difference of 0.28%), and Immigrants from Sudan (9.2%, a difference of 0.41%). Similarly, the demographic groups most similar to Slovenes are Immigrants from England (9.3%, a difference of 0.010%), Immigrants from Cameroon (9.3%, a difference of 0.050%), Hawaiian (9.3%, a difference of 0.16%), Brazilian (9.3%, a difference of 0.28%), and Celtic (9.3%, a difference of 0.31%).
| Demographics | Rating | Rank | Unemployment Among Seniors over 75 years |
| Sub-Saharan Africans | 2.3 /100 | #247 | Tragic 9.2% |
| Blackfeet | 2.3 /100 | #248 | Tragic 9.2% |
| Immigrants | Saudi Arabia | 2.2 /100 | #249 | Tragic 9.2% |
| Central American Indians | 2.2 /100 | #250 | Tragic 9.2% |
| Immigrants | Poland | 2.0 /100 | #251 | Tragic 9.2% |
| Immigrants | Sudan | 2.0 /100 | #252 | Tragic 9.2% |
| Pima | 1.8 /100 | #253 | Tragic 9.2% |
| Immigrants | Ghana | 1.7 /100 | #254 | Tragic 9.2% |
| Immigrants | Scotland | 1.4 /100 | #255 | Tragic 9.2% |
| Brazilians | 1.3 /100 | #256 | Tragic 9.3% |
| Hawaiians | 1.2 /100 | #257 | Tragic 9.3% |
| Immigrants | England | 1.0 /100 | #258 | Tragic 9.3% |
| Slovenes | 1.0 /100 | #259 | Tragic 9.3% |
| Immigrants | Cameroon | 1.0 /100 | #260 | Tragic 9.3% |
| Celtics | 0.8 /100 | #261 | Tragic 9.3% |
| Austrians | 0.7 /100 | #262 | Tragic 9.3% |
| Ukrainians | 0.7 /100 | #263 | Tragic 9.3% |
| Iroquois | 0.7 /100 | #264 | Tragic 9.3% |
| Palestinians | 0.6 /100 | #265 | Tragic 9.3% |
| Blacks/African Americans | 0.5 /100 | #266 | Tragic 9.4% |
| Immigrants | Mexico | 0.4 /100 | #267 | Tragic 9.4% |