Immigrants from Russia vs Ottawa Unemployment Among Ages 30 to 34 years
COMPARE
Immigrants from Russia
Ottawa
Unemployment Among Ages 30 to 34 years
Unemployment Among Ages 30 to 34 years Comparison
Immigrants from Russia
Ottawa
5.4%
UNEMPLOYMENT AMONG AGES 30 TO 34 YEARS
71.0/ 100
METRIC RATING
144th/ 347
METRIC RANK
6.3%
UNEMPLOYMENT AMONG AGES 30 TO 34 YEARS
0.0/ 100
METRIC RATING
273rd/ 347
METRIC RANK
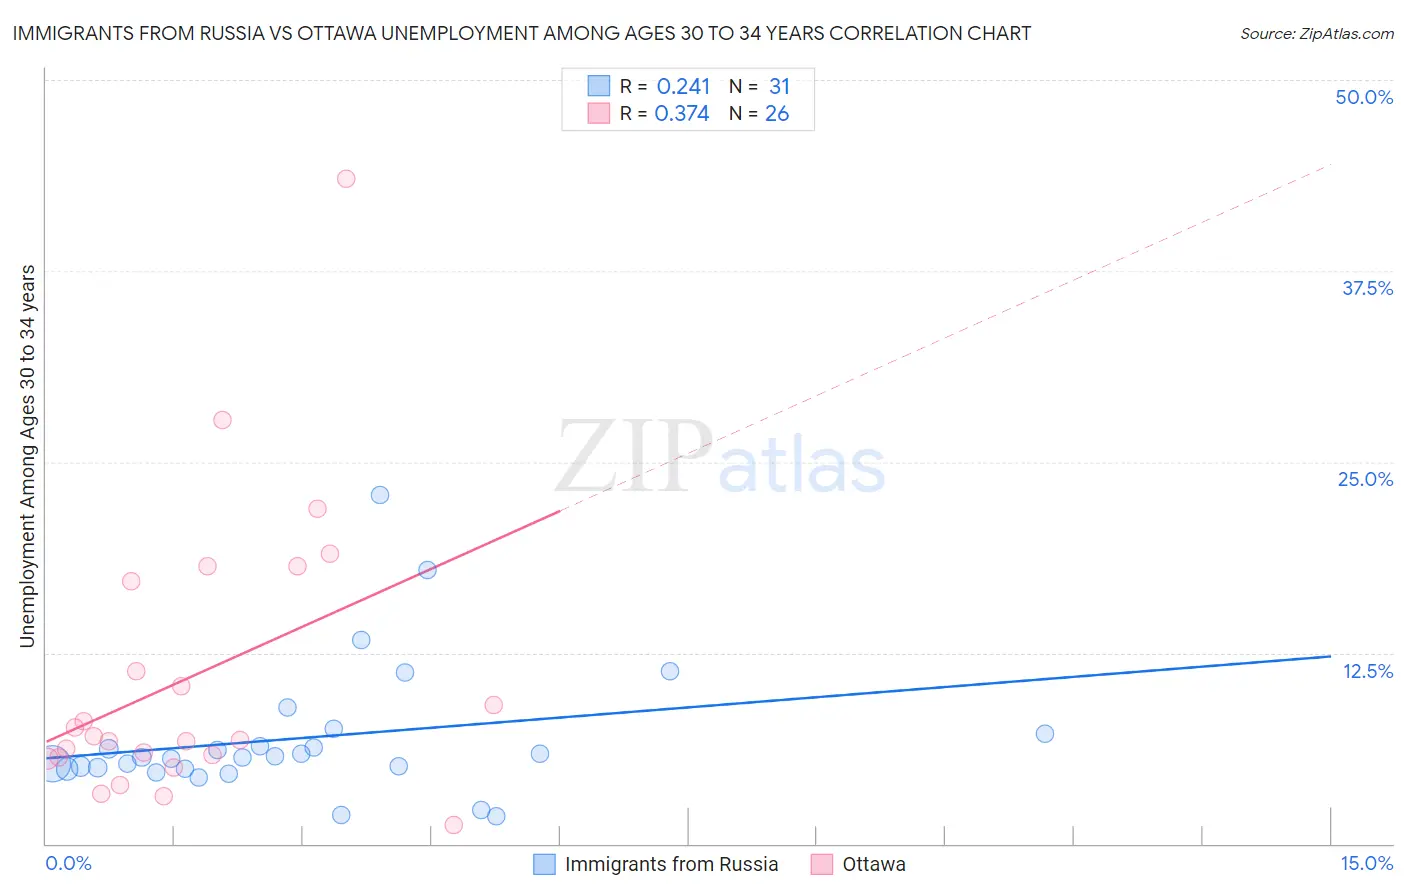
Immigrants from Russia vs Ottawa Unemployment Among Ages 30 to 34 years Correlation Chart
The statistical analysis conducted on geographies consisting of 329,311,321 people shows a weak positive correlation between the proportion of Immigrants from Russia and unemployment rate among population between the ages 30 and 34 in the United States with a correlation coefficient (R) of 0.241 and weighted average of 5.4%. Similarly, the statistical analysis conducted on geographies consisting of 48,740,680 people shows a mild positive correlation between the proportion of Ottawa and unemployment rate among population between the ages 30 and 34 in the United States with a correlation coefficient (R) of 0.374 and weighted average of 6.3%, a difference of 16.7%.
Unemployment Among Ages 30 to 34 years Correlation Summary
| Measurement | Immigrants from Russia | Ottawa |
| Minimum | 1.8% | 1.2% |
| Maximum | 22.8% | 43.5% |
| Range | 21.0% | 42.3% |
| Mean | 6.9% | 11.0% |
| Median | 5.7% | 6.9% |
| Interquartile 25% (IQ1) | 4.9% | 5.7% |
| Interquartile 75% (IQ3) | 7.2% | 17.2% |
| Interquartile Range (IQR) | 2.3% | 11.5% |
| Standard Deviation (Sample) | 4.4% | 9.4% |
| Standard Deviation (Population) | 4.3% | 9.2% |
Similar Demographics by Unemployment Among Ages 30 to 34 years
Demographics Similar to Immigrants from Russia by Unemployment Among Ages 30 to 34 years
In terms of unemployment among ages 30 to 34 years, the demographic groups most similar to Immigrants from Russia are Russian (5.4%, a difference of 0.020%), Syrian (5.4%, a difference of 0.060%), Celtic (5.4%, a difference of 0.060%), Immigrants from Greece (5.4%, a difference of 0.090%), and Immigrants from Europe (5.4%, a difference of 0.10%).
| Demographics | Rating | Rank | Unemployment Among Ages 30 to 34 years |
| Immigrants | Canada | 74.6 /100 | #137 | Good 5.4% |
| Serbians | 72.9 /100 | #138 | Good 5.4% |
| Lithuanians | 72.4 /100 | #139 | Good 5.4% |
| Immigrants | North America | 72.2 /100 | #140 | Good 5.4% |
| Immigrants | Europe | 72.1 /100 | #141 | Good 5.4% |
| Immigrants | Greece | 72.0 /100 | #142 | Good 5.4% |
| Russians | 71.1 /100 | #143 | Good 5.4% |
| Immigrants | Russia | 71.0 /100 | #144 | Good 5.4% |
| Syrians | 70.3 /100 | #145 | Good 5.4% |
| Celtics | 70.2 /100 | #146 | Good 5.4% |
| Ukrainians | 69.2 /100 | #147 | Good 5.4% |
| Immigrants | Iran | 69.1 /100 | #148 | Good 5.4% |
| Immigrants | Colombia | 68.9 /100 | #149 | Good 5.4% |
| Colombians | 68.7 /100 | #150 | Good 5.4% |
| Immigrants | Oceania | 68.1 /100 | #151 | Good 5.4% |
Demographics Similar to Ottawa by Unemployment Among Ages 30 to 34 years
In terms of unemployment among ages 30 to 34 years, the demographic groups most similar to Ottawa are Blackfeet (6.3%, a difference of 0.010%), U.S. Virgin Islander (6.3%, a difference of 0.010%), Ecuadorian (6.3%, a difference of 0.11%), Comanche (6.3%, a difference of 0.12%), and Pennsylvania German (6.3%, a difference of 0.17%).
| Demographics | Rating | Rank | Unemployment Among Ages 30 to 34 years |
| Seminole | 0.0 /100 | #266 | Tragic 6.2% |
| Immigrants | Mexico | 0.0 /100 | #267 | Tragic 6.2% |
| Immigrants | Haiti | 0.0 /100 | #268 | Tragic 6.2% |
| French American Indians | 0.0 /100 | #269 | Tragic 6.3% |
| Immigrants | Senegal | 0.0 /100 | #270 | Tragic 6.3% |
| Comanche | 0.0 /100 | #271 | Tragic 6.3% |
| Blackfeet | 0.0 /100 | #272 | Tragic 6.3% |
| Ottawa | 0.0 /100 | #273 | Tragic 6.3% |
| U.S. Virgin Islanders | 0.0 /100 | #274 | Tragic 6.3% |
| Ecuadorians | 0.0 /100 | #275 | Tragic 6.3% |
| Pennsylvania Germans | 0.0 /100 | #276 | Tragic 6.3% |
| Immigrants | Ecuador | 0.0 /100 | #277 | Tragic 6.3% |
| Osage | 0.0 /100 | #278 | Tragic 6.3% |
| Cree | 0.0 /100 | #279 | Tragic 6.4% |
| Cherokee | 0.0 /100 | #280 | Tragic 6.4% |