Immigrants from Russia vs Costa Rican Unemployment Among Ages 35 to 44 years
COMPARE
Immigrants from Russia
Costa Rican
Unemployment Among Ages 35 to 44 years
Unemployment Among Ages 35 to 44 years Comparison
Immigrants from Russia
Costa Ricans
4.6%
UNEMPLOYMENT AMONG AGES 35 TO 44 YEARS
75.4/ 100
METRIC RATING
144th/ 347
METRIC RANK
4.7%
UNEMPLOYMENT AMONG AGES 35 TO 44 YEARS
59.6/ 100
METRIC RATING
162nd/ 347
METRIC RANK
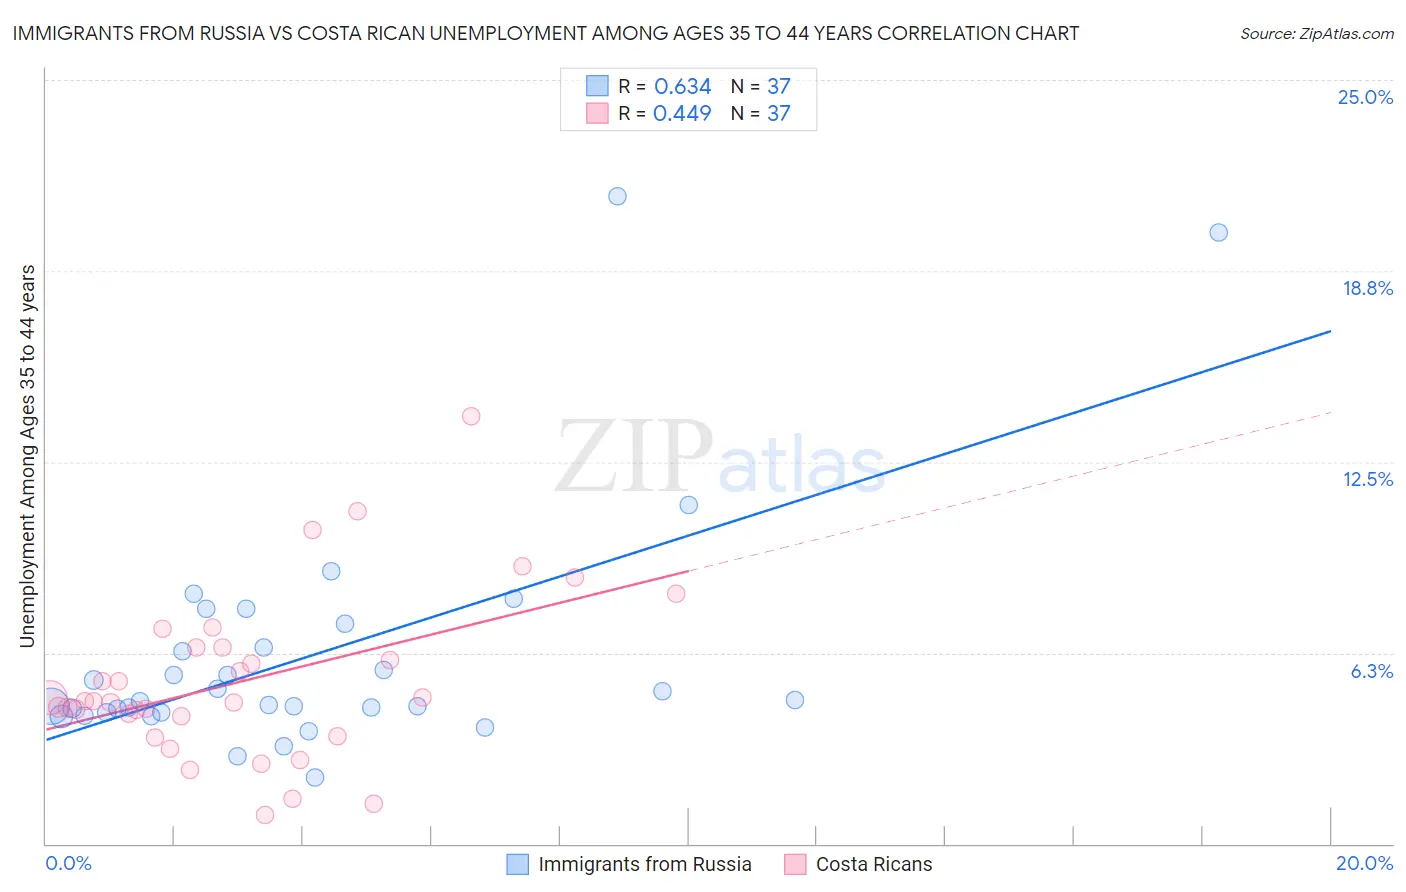
Immigrants from Russia vs Costa Rican Unemployment Among Ages 35 to 44 years Correlation Chart
The statistical analysis conducted on geographies consisting of 341,240,245 people shows a significant positive correlation between the proportion of Immigrants from Russia and unemployment rate among population between the ages 35 and 44 in the United States with a correlation coefficient (R) of 0.634 and weighted average of 4.6%. Similarly, the statistical analysis conducted on geographies consisting of 250,693,311 people shows a moderate positive correlation between the proportion of Costa Ricans and unemployment rate among population between the ages 35 and 44 in the United States with a correlation coefficient (R) of 0.449 and weighted average of 4.7%, a difference of 1.3%.
Unemployment Among Ages 35 to 44 years Correlation Summary
| Measurement | Immigrants from Russia | Costa Rican |
| Minimum | 2.2% | 0.95% |
| Maximum | 21.2% | 14.0% |
| Range | 19.0% | 13.1% |
| Mean | 6.1% | 5.3% |
| Median | 4.7% | 4.7% |
| Interquartile 25% (IQ1) | 4.3% | 3.8% |
| Interquartile 75% (IQ3) | 6.8% | 6.4% |
| Interquartile Range (IQR) | 2.5% | 2.6% |
| Standard Deviation (Sample) | 3.9% | 2.7% |
| Standard Deviation (Population) | 3.9% | 2.7% |
Demographics Similar to Immigrants from Russia and Costa Ricans by Unemployment Among Ages 35 to 44 years
In terms of unemployment among ages 35 to 44 years, the demographic groups most similar to Immigrants from Russia are Immigrants from Switzerland (4.6%, a difference of 0.010%), Immigrants from Eastern Europe (4.6%, a difference of 0.070%), Immigrants from Denmark (4.6%, a difference of 0.10%), Immigrants from Vietnam (4.6%, a difference of 0.16%), and Slavic (4.6%, a difference of 0.28%). Similarly, the demographic groups most similar to Costa Ricans are South African (4.7%, a difference of 0.080%), Celtic (4.7%, a difference of 0.15%), Hungarian (4.6%, a difference of 0.22%), Albanian (4.6%, a difference of 0.26%), and Immigrants from Iran (4.6%, a difference of 0.27%).
| Demographics | Rating | Rank | Unemployment Among Ages 35 to 44 years |
| Immigrants | Switzerland | 75.5 /100 | #143 | Good 4.6% |
| Immigrants | Russia | 75.4 /100 | #144 | Good 4.6% |
| Immigrants | Eastern Europe | 74.7 /100 | #145 | Good 4.6% |
| Immigrants | Denmark | 74.4 /100 | #146 | Good 4.6% |
| Immigrants | Vietnam | 73.8 /100 | #147 | Good 4.6% |
| Slavs | 72.4 /100 | #148 | Good 4.6% |
| Immigrants | Burma/Myanmar | 72.2 /100 | #149 | Good 4.6% |
| Immigrants | England | 70.5 /100 | #150 | Good 4.6% |
| Puget Sound Salish | 67.1 /100 | #151 | Good 4.6% |
| Pakistanis | 67.1 /100 | #152 | Good 4.6% |
| Immigrants | Brazil | 67.0 /100 | #153 | Good 4.6% |
| Immigrants | Western Europe | 65.5 /100 | #154 | Good 4.6% |
| Whites/Caucasians | 64.9 /100 | #155 | Good 4.6% |
| South Americans | 63.7 /100 | #156 | Good 4.6% |
| Immigrants | Belarus | 63.4 /100 | #157 | Good 4.6% |
| Immigrants | Iran | 63.1 /100 | #158 | Good 4.6% |
| Albanians | 63.0 /100 | #159 | Good 4.6% |
| Hungarians | 62.6 /100 | #160 | Good 4.6% |
| Celtics | 61.7 /100 | #161 | Good 4.7% |
| Costa Ricans | 59.6 /100 | #162 | Average 4.7% |
| South Africans | 58.5 /100 | #163 | Average 4.7% |