Immigrants from Romania vs New Zealander Unemployment Among Ages 45 to 54 years
COMPARE
Immigrants from Romania
New Zealander
Unemployment Among Ages 45 to 54 years
Unemployment Among Ages 45 to 54 years Comparison
Immigrants from Romania
New Zealanders
4.4%
UNEMPLOYMENT AMONG AGES 45 TO 54 YEARS
90.0/ 100
METRIC RATING
118th/ 347
METRIC RANK
4.4%
UNEMPLOYMENT AMONG AGES 45 TO 54 YEARS
91.9/ 100
METRIC RATING
109th/ 347
METRIC RANK
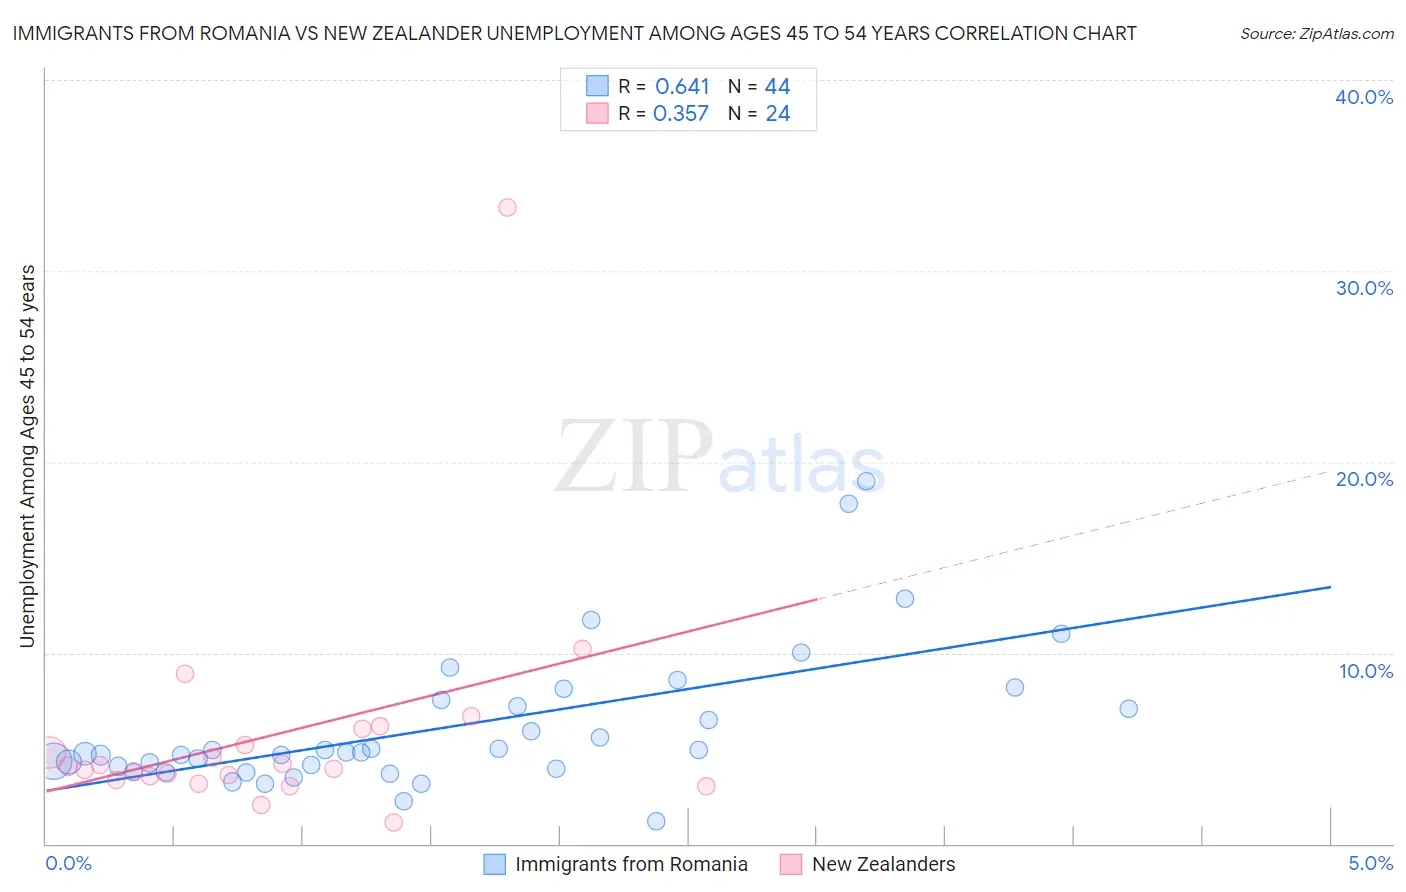
Immigrants from Romania vs New Zealander Unemployment Among Ages 45 to 54 years Correlation Chart
The statistical analysis conducted on geographies consisting of 253,287,738 people shows a significant positive correlation between the proportion of Immigrants from Romania and unemployment rate among population between the ages 45 and 54 in the United States with a correlation coefficient (R) of 0.641 and weighted average of 4.4%. Similarly, the statistical analysis conducted on geographies consisting of 106,011,822 people shows a mild positive correlation between the proportion of New Zealanders and unemployment rate among population between the ages 45 and 54 in the United States with a correlation coefficient (R) of 0.357 and weighted average of 4.4%, a difference of 0.28%.
Unemployment Among Ages 45 to 54 years Correlation Summary
| Measurement | Immigrants from Romania | New Zealander |
| Minimum | 1.2% | 1.1% |
| Maximum | 19.0% | 33.3% |
| Range | 17.8% | 32.2% |
| Mean | 6.1% | 5.7% |
| Median | 4.8% | 4.0% |
| Interquartile 25% (IQ1) | 4.0% | 3.4% |
| Interquartile 75% (IQ3) | 7.4% | 5.6% |
| Interquartile Range (IQR) | 3.4% | 2.2% |
| Standard Deviation (Sample) | 3.7% | 6.2% |
| Standard Deviation (Population) | 3.6% | 6.1% |
Demographics Similar to Immigrants from Romania and New Zealanders by Unemployment Among Ages 45 to 54 years
In terms of unemployment among ages 45 to 54 years, the demographic groups most similar to Immigrants from Romania are Native Hawaiian (4.4%, a difference of 0.010%), South African (4.4%, a difference of 0.060%), American (4.4%, a difference of 0.060%), Immigrants from Oceania (4.4%, a difference of 0.070%), and Immigrants from Kazakhstan (4.4%, a difference of 0.070%). Similarly, the demographic groups most similar to New Zealanders are Russian (4.4%, a difference of 0.030%), Iranian (4.4%, a difference of 0.090%), Immigrants from South Africa (4.4%, a difference of 0.090%), Immigrants from England (4.4%, a difference of 0.10%), and Immigrants from Nicaragua (4.4%, a difference of 0.11%).
| Demographics | Rating | Rank | Unemployment Among Ages 45 to 54 years |
| Icelanders | 93.5 /100 | #103 | Exceptional 4.4% |
| Immigrants | Sweden | 93.0 /100 | #104 | Exceptional 4.4% |
| Immigrants | Kenya | 92.8 /100 | #105 | Exceptional 4.4% |
| Iranians | 92.5 /100 | #106 | Exceptional 4.4% |
| Immigrants | South Africa | 92.5 /100 | #107 | Exceptional 4.4% |
| Russians | 92.1 /100 | #108 | Exceptional 4.4% |
| New Zealanders | 91.9 /100 | #109 | Exceptional 4.4% |
| Immigrants | England | 91.3 /100 | #110 | Exceptional 4.4% |
| Immigrants | Nicaragua | 91.3 /100 | #111 | Exceptional 4.4% |
| Immigrants | Saudi Arabia | 91.1 /100 | #112 | Exceptional 4.4% |
| French Canadians | 91.0 /100 | #113 | Exceptional 4.4% |
| Immigrants | Chile | 90.9 /100 | #114 | Exceptional 4.4% |
| Pakistanis | 90.7 /100 | #115 | Exceptional 4.4% |
| Immigrants | North Macedonia | 90.6 /100 | #116 | Exceptional 4.4% |
| South Africans | 90.4 /100 | #117 | Exceptional 4.4% |
| Immigrants | Romania | 90.0 /100 | #118 | Exceptional 4.4% |
| Native Hawaiians | 90.0 /100 | #119 | Excellent 4.4% |
| Americans | 89.6 /100 | #120 | Excellent 4.4% |
| Immigrants | Oceania | 89.5 /100 | #121 | Excellent 4.4% |
| Immigrants | Kazakhstan | 89.5 /100 | #122 | Excellent 4.4% |
| Immigrants | Asia | 88.8 /100 | #123 | Excellent 4.4% |