Immigrants from Portugal vs South American Unemployment Among Seniors over 75 years
COMPARE
Immigrants from Portugal
South American
Unemployment Among Seniors over 75 years
Unemployment Among Seniors over 75 years Comparison
Immigrants from Portugal
South Americans
10.5%
UNEMPLOYMENT AMONG SENIORS OVER 75 YEARS
0.0/ 100
METRIC RATING
328th/ 347
METRIC RANK
8.5%
UNEMPLOYMENT AMONG SENIORS OVER 75 YEARS
87.9/ 100
METRIC RATING
140th/ 347
METRIC RANK
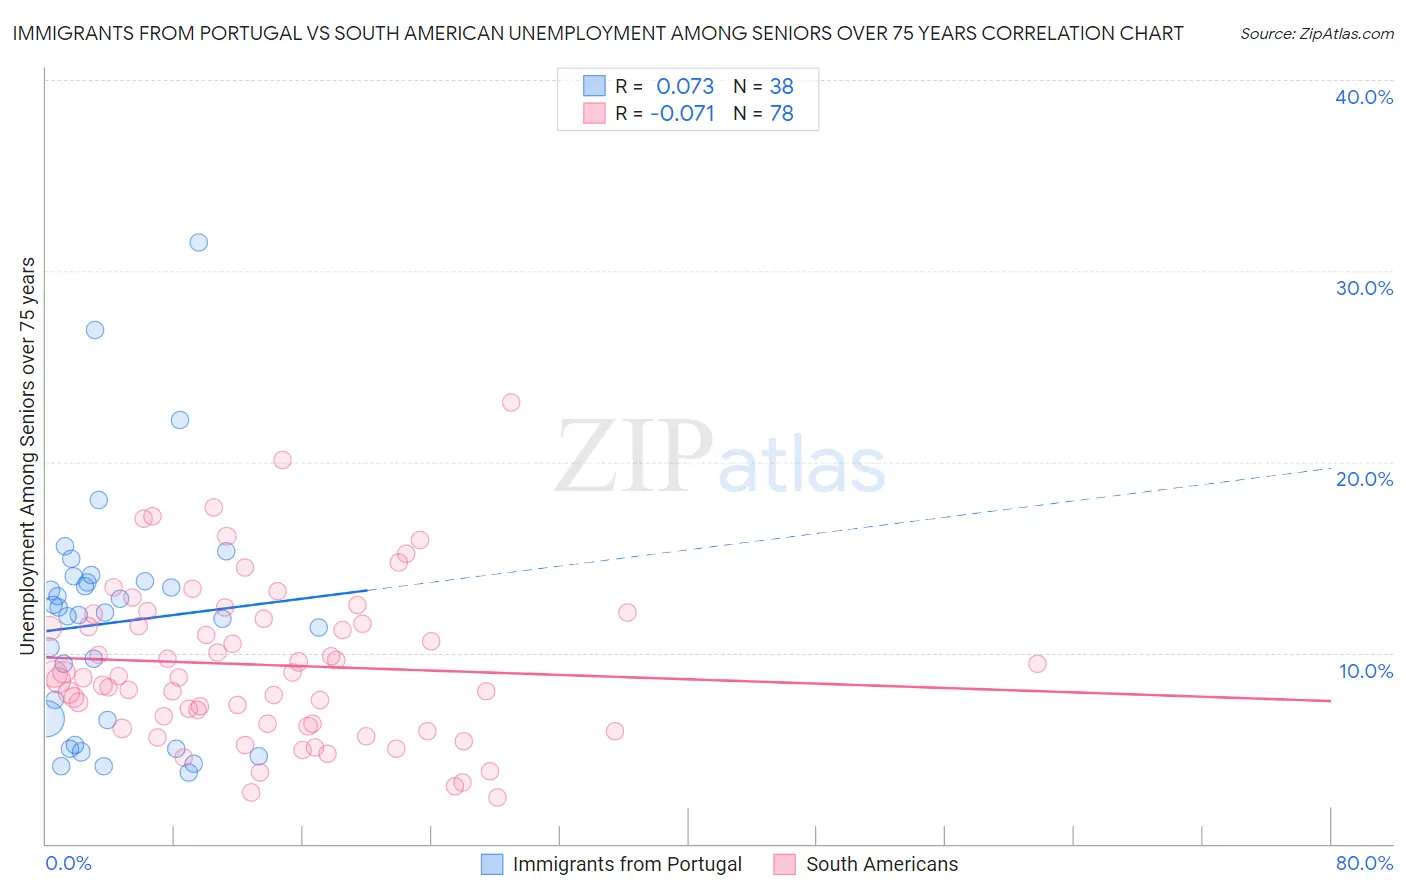
Immigrants from Portugal vs South American Unemployment Among Seniors over 75 years Correlation Chart
The statistical analysis conducted on geographies consisting of 117,162,962 people shows a slight positive correlation between the proportion of Immigrants from Portugal and unemployment rate among seniors over the age of 75 in the United States with a correlation coefficient (R) of 0.073 and weighted average of 10.5%. Similarly, the statistical analysis conducted on geographies consisting of 225,828,000 people shows a slight negative correlation between the proportion of South Americans and unemployment rate among seniors over the age of 75 in the United States with a correlation coefficient (R) of -0.071 and weighted average of 8.5%, a difference of 23.3%.
Unemployment Among Seniors over 75 years Correlation Summary
| Measurement | Immigrants from Portugal | South American |
| Minimum | 3.7% | 2.4% |
| Maximum | 31.5% | 23.1% |
| Range | 27.8% | 20.7% |
| Mean | 11.6% | 9.4% |
| Median | 12.1% | 8.8% |
| Interquartile 25% (IQ1) | 6.5% | 6.3% |
| Interquartile 75% (IQ3) | 13.7% | 11.8% |
| Interquartile Range (IQR) | 7.2% | 5.5% |
| Standard Deviation (Sample) | 6.1% | 4.1% |
| Standard Deviation (Population) | 6.1% | 4.1% |
Similar Demographics by Unemployment Among Seniors over 75 years
Demographics Similar to Immigrants from Portugal by Unemployment Among Seniors over 75 years
In terms of unemployment among seniors over 75 years, the demographic groups most similar to Immigrants from Portugal are Tsimshian (10.5%, a difference of 0.35%), Dutch (10.4%, a difference of 0.63%), Slovak (10.4%, a difference of 0.71%), Portuguese (10.4%, a difference of 0.95%), and American (10.4%, a difference of 1.1%).
| Demographics | Rating | Rank | Unemployment Among Seniors over 75 years |
| Aleuts | 0.0 /100 | #321 | Tragic 10.3% |
| Poles | 0.0 /100 | #322 | Tragic 10.3% |
| Tongans | 0.0 /100 | #323 | Tragic 10.4% |
| Americans | 0.0 /100 | #324 | Tragic 10.4% |
| Portuguese | 0.0 /100 | #325 | Tragic 10.4% |
| Slovaks | 0.0 /100 | #326 | Tragic 10.4% |
| Dutch | 0.0 /100 | #327 | Tragic 10.4% |
| Immigrants | Portugal | 0.0 /100 | #328 | Tragic 10.5% |
| Tsimshian | 0.0 /100 | #329 | Tragic 10.5% |
| Immigrants | Azores | 0.0 /100 | #330 | Tragic 10.7% |
| Tohono O'odham | 0.0 /100 | #331 | Tragic 10.8% |
| Immigrants | Liberia | 0.0 /100 | #332 | Tragic 10.9% |
| Alaskan Athabascans | 0.0 /100 | #333 | Tragic 11.0% |
| Assyrians/Chaldeans/Syriacs | 0.0 /100 | #334 | Tragic 11.1% |
| French Canadians | 0.0 /100 | #335 | Tragic 11.2% |
Demographics Similar to South Americans by Unemployment Among Seniors over 75 years
In terms of unemployment among seniors over 75 years, the demographic groups most similar to South Americans are Immigrants from Bolivia (8.5%, a difference of 0.0%), Barbadian (8.5%, a difference of 0.090%), Immigrants from Ukraine (8.5%, a difference of 0.11%), Immigrants from Costa Rica (8.5%, a difference of 0.14%), and Colombian (8.5%, a difference of 0.15%).
| Demographics | Rating | Rank | Unemployment Among Seniors over 75 years |
| Serbians | 93.7 /100 | #133 | Exceptional 8.4% |
| Immigrants | Czechoslovakia | 93.4 /100 | #134 | Exceptional 8.4% |
| Haitians | 91.4 /100 | #135 | Exceptional 8.5% |
| Immigrants | Trinidad and Tobago | 90.8 /100 | #136 | Exceptional 8.5% |
| Immigrants | Kuwait | 90.5 /100 | #137 | Exceptional 8.5% |
| Immigrants | Bulgaria | 89.6 /100 | #138 | Excellent 8.5% |
| Barbadians | 88.6 /100 | #139 | Excellent 8.5% |
| South Americans | 87.9 /100 | #140 | Excellent 8.5% |
| Immigrants | Bolivia | 87.9 /100 | #141 | Excellent 8.5% |
| Immigrants | Ukraine | 87.0 /100 | #142 | Excellent 8.5% |
| Immigrants | Costa Rica | 86.8 /100 | #143 | Excellent 8.5% |
| Colombians | 86.7 /100 | #144 | Excellent 8.5% |
| Immigrants | Romania | 86.2 /100 | #145 | Excellent 8.5% |
| Immigrants | South Eastern Asia | 85.8 /100 | #146 | Excellent 8.5% |
| Immigrants | Sierra Leone | 85.6 /100 | #147 | Excellent 8.5% |