Immigrants from Portugal vs Romanian Unemployment Among Women with Children Under 18 years
COMPARE
Immigrants from Portugal
Romanian
Unemployment Among Women with Children Under 18 years
Unemployment Among Women with Children Under 18 years Comparison
Immigrants from Portugal
Romanians
6.3%
UNEMPLOYMENT AMONG WOMEN WITH CHILDREN UNDER 18 YEARS
0.0/ 100
METRIC RATING
279th/ 347
METRIC RANK
5.2%
UNEMPLOYMENT AMONG WOMEN WITH CHILDREN UNDER 18 YEARS
95.3/ 100
METRIC RATING
82nd/ 347
METRIC RANK
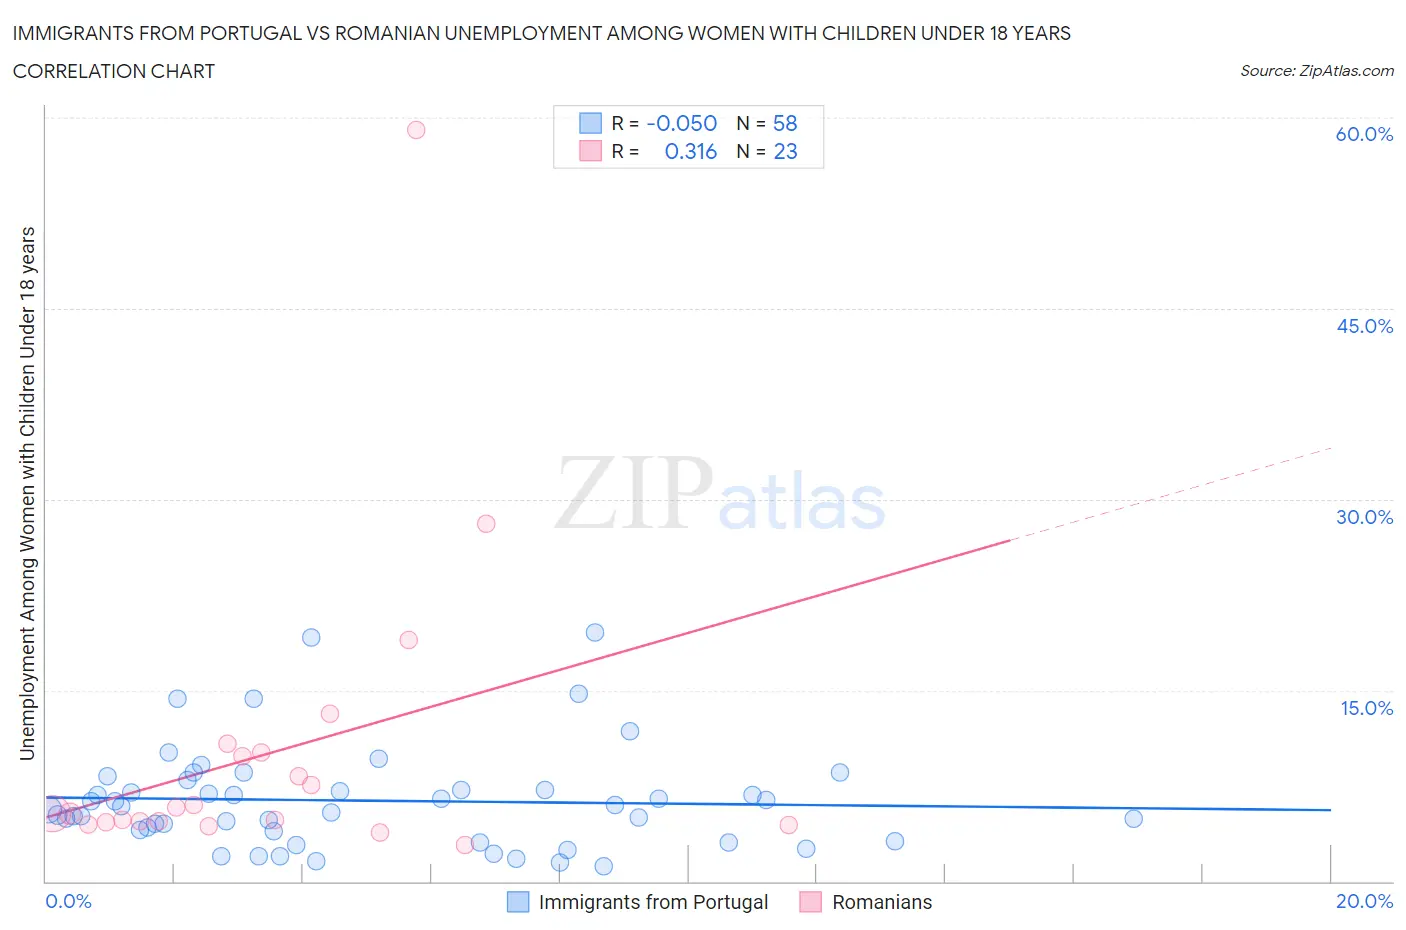
Immigrants from Portugal vs Romanian Unemployment Among Women with Children Under 18 years Correlation Chart
The statistical analysis conducted on geographies consisting of 170,999,296 people shows no correlation between the proportion of Immigrants from Portugal and unemployment rate among women with children under the age of 18 in the United States with a correlation coefficient (R) of -0.050 and weighted average of 6.3%. Similarly, the statistical analysis conducted on geographies consisting of 361,905,947 people shows a mild positive correlation between the proportion of Romanians and unemployment rate among women with children under the age of 18 in the United States with a correlation coefficient (R) of 0.316 and weighted average of 5.2%, a difference of 21.4%.
Unemployment Among Women with Children Under 18 years Correlation Summary
| Measurement | Immigrants from Portugal | Romanian |
| Minimum | 1.2% | 2.8% |
| Maximum | 19.5% | 59.0% |
| Range | 18.3% | 56.2% |
| Mean | 6.3% | 10.1% |
| Median | 5.8% | 5.3% |
| Interquartile 25% (IQ1) | 4.0% | 4.6% |
| Interquartile 75% (IQ3) | 7.2% | 10.2% |
| Interquartile Range (IQR) | 3.2% | 5.5% |
| Standard Deviation (Sample) | 4.0% | 12.1% |
| Standard Deviation (Population) | 3.9% | 11.9% |
Similar Demographics by Unemployment Among Women with Children Under 18 years
Demographics Similar to Immigrants from Portugal by Unemployment Among Women with Children Under 18 years
In terms of unemployment among women with children under 18 years, the demographic groups most similar to Immigrants from Portugal are Immigrants from Barbados (6.2%, a difference of 0.39%), Mexican American Indian (6.2%, a difference of 0.40%), Immigrants from Ghana (6.2%, a difference of 0.42%), Guatemalan (6.3%, a difference of 0.50%), and Dutch West Indian (6.2%, a difference of 0.52%).
| Demographics | Rating | Rank | Unemployment Among Women with Children Under 18 years |
| Salvadorans | 0.0 /100 | #272 | Tragic 6.2% |
| Immigrants | Western Africa | 0.0 /100 | #273 | Tragic 6.2% |
| Senegalese | 0.0 /100 | #274 | Tragic 6.2% |
| Dutch West Indians | 0.0 /100 | #275 | Tragic 6.2% |
| Immigrants | Ghana | 0.0 /100 | #276 | Tragic 6.2% |
| Mexican American Indians | 0.0 /100 | #277 | Tragic 6.2% |
| Immigrants | Barbados | 0.0 /100 | #278 | Tragic 6.2% |
| Immigrants | Portugal | 0.0 /100 | #279 | Tragic 6.3% |
| Guatemalans | 0.0 /100 | #280 | Tragic 6.3% |
| Immigrants | El Salvador | 0.0 /100 | #281 | Tragic 6.3% |
| Immigrants | St. Vincent and the Grenadines | 0.0 /100 | #282 | Tragic 6.3% |
| West Indians | 0.0 /100 | #283 | Tragic 6.3% |
| Immigrants | Grenada | 0.0 /100 | #284 | Tragic 6.3% |
| Bahamians | 0.0 /100 | #285 | Tragic 6.3% |
| Alaskan Athabascans | 0.0 /100 | #286 | Tragic 6.3% |
Demographics Similar to Romanians by Unemployment Among Women with Children Under 18 years
In terms of unemployment among women with children under 18 years, the demographic groups most similar to Romanians are Immigrants from Lithuania (5.2%, a difference of 0.050%), Bolivian (5.1%, a difference of 0.080%), Maltese (5.2%, a difference of 0.10%), Australian (5.2%, a difference of 0.10%), and Immigrants from Croatia (5.1%, a difference of 0.13%).
| Demographics | Rating | Rank | Unemployment Among Women with Children Under 18 years |
| Immigrants | Asia | 95.8 /100 | #75 | Exceptional 5.1% |
| Puget Sound Salish | 95.8 /100 | #76 | Exceptional 5.1% |
| Zimbabweans | 95.7 /100 | #77 | Exceptional 5.1% |
| Assyrians/Chaldeans/Syriacs | 95.7 /100 | #78 | Exceptional 5.1% |
| Immigrants | Croatia | 95.6 /100 | #79 | Exceptional 5.1% |
| Bolivians | 95.5 /100 | #80 | Exceptional 5.1% |
| Immigrants | Lithuania | 95.4 /100 | #81 | Exceptional 5.2% |
| Romanians | 95.3 /100 | #82 | Exceptional 5.2% |
| Maltese | 95.1 /100 | #83 | Exceptional 5.2% |
| Australians | 95.1 /100 | #84 | Exceptional 5.2% |
| Paraguayans | 94.8 /100 | #85 | Exceptional 5.2% |
| Immigrants | Indonesia | 94.8 /100 | #86 | Exceptional 5.2% |
| Laotians | 94.7 /100 | #87 | Exceptional 5.2% |
| Immigrants | Scotland | 94.5 /100 | #88 | Exceptional 5.2% |
| Immigrants | Turkey | 94.2 /100 | #89 | Exceptional 5.2% |