Immigrants from Poland vs Crow Unemployment Among Ages 30 to 34 years
COMPARE
Immigrants from Poland
Crow
Unemployment Among Ages 30 to 34 years
Unemployment Among Ages 30 to 34 years Comparison
Immigrants from Poland
Crow
5.3%
UNEMPLOYMENT AMONG AGES 30 TO 34 YEARS
82.4/ 100
METRIC RATING
120th/ 347
METRIC RANK
10.3%
UNEMPLOYMENT AMONG AGES 30 TO 34 YEARS
0.0/ 100
METRIC RATING
340th/ 347
METRIC RANK
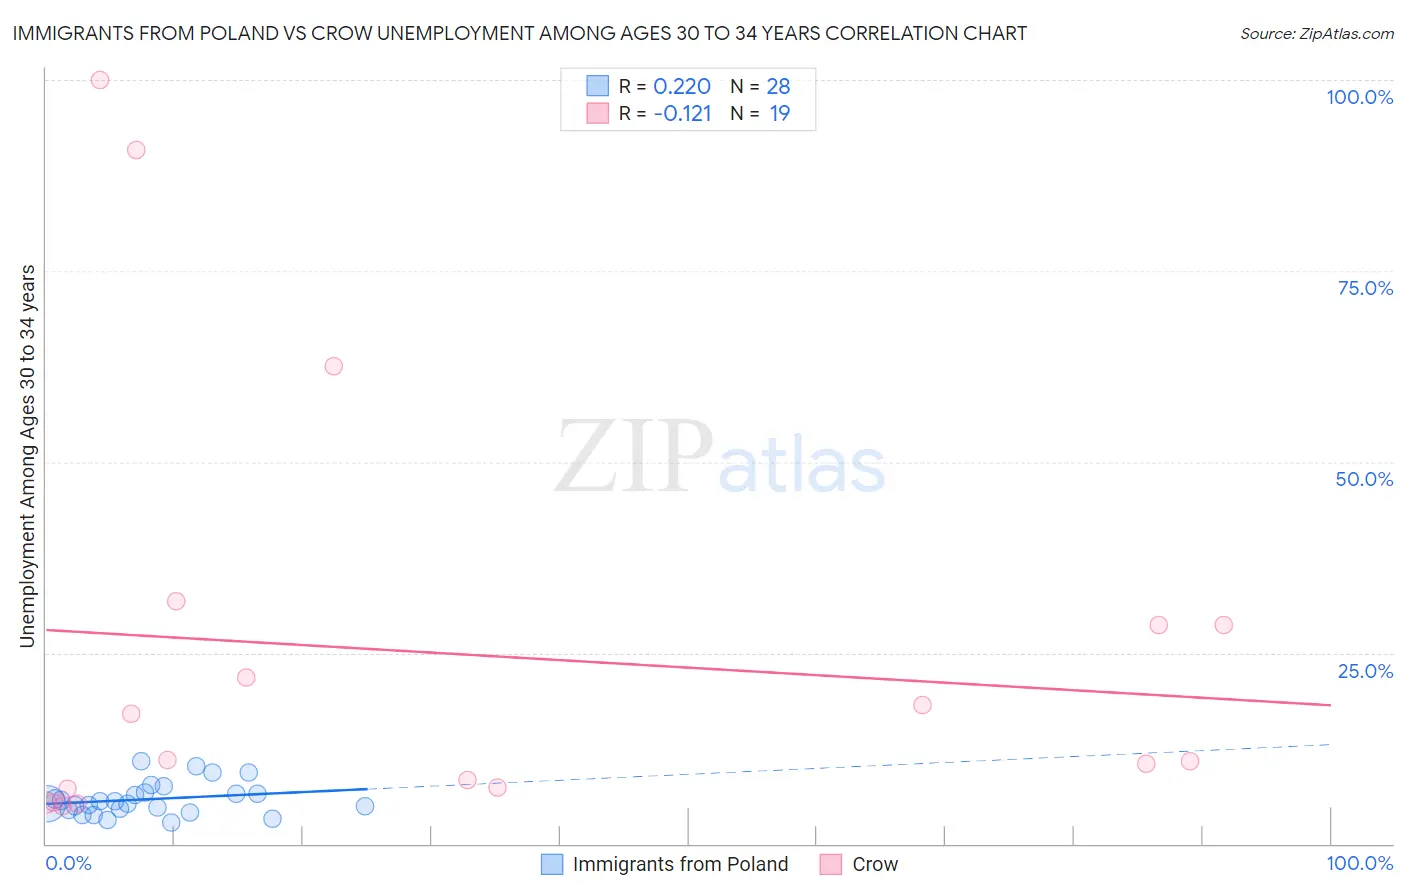
Immigrants from Poland vs Crow Unemployment Among Ages 30 to 34 years Correlation Chart
The statistical analysis conducted on geographies consisting of 289,585,828 people shows a weak positive correlation between the proportion of Immigrants from Poland and unemployment rate among population between the ages 30 and 34 in the United States with a correlation coefficient (R) of 0.220 and weighted average of 5.3%. Similarly, the statistical analysis conducted on geographies consisting of 58,132,383 people shows a poor negative correlation between the proportion of Crow and unemployment rate among population between the ages 30 and 34 in the United States with a correlation coefficient (R) of -0.121 and weighted average of 10.3%, a difference of 94.7%.
Unemployment Among Ages 30 to 34 years Correlation Summary
| Measurement | Immigrants from Poland | Crow |
| Minimum | 2.8% | 4.9% |
| Maximum | 10.8% | 100.0% |
| Range | 8.0% | 95.1% |
| Mean | 5.8% | 25.0% |
| Median | 5.4% | 10.9% |
| Interquartile 25% (IQ1) | 4.5% | 7.1% |
| Interquartile 75% (IQ3) | 6.6% | 28.6% |
| Interquartile Range (IQR) | 2.1% | 21.5% |
| Standard Deviation (Sample) | 2.1% | 28.5% |
| Standard Deviation (Population) | 2.1% | 27.8% |
Similar Demographics by Unemployment Among Ages 30 to 34 years
Demographics Similar to Immigrants from Poland by Unemployment Among Ages 30 to 34 years
In terms of unemployment among ages 30 to 34 years, the demographic groups most similar to Immigrants from Poland are New Zealander (5.3%, a difference of 0.010%), Romanian (5.3%, a difference of 0.010%), Immigrants from Netherlands (5.3%, a difference of 0.070%), Immigrants from South Africa (5.3%, a difference of 0.080%), and Australian (5.3%, a difference of 0.090%).
| Demographics | Rating | Rank | Unemployment Among Ages 30 to 34 years |
| Immigrants | Spain | 85.6 /100 | #113 | Excellent 5.3% |
| Estonians | 83.7 /100 | #114 | Excellent 5.3% |
| Immigrants | Albania | 83.4 /100 | #115 | Excellent 5.3% |
| Eastern Europeans | 83.2 /100 | #116 | Excellent 5.3% |
| Australians | 83.1 /100 | #117 | Excellent 5.3% |
| Immigrants | South Africa | 83.0 /100 | #118 | Excellent 5.3% |
| New Zealanders | 82.5 /100 | #119 | Excellent 5.3% |
| Immigrants | Poland | 82.4 /100 | #120 | Excellent 5.3% |
| Romanians | 82.3 /100 | #121 | Excellent 5.3% |
| Immigrants | Netherlands | 81.8 /100 | #122 | Excellent 5.3% |
| Immigrants | Italy | 81.1 /100 | #123 | Excellent 5.3% |
| Immigrants | Brazil | 80.8 /100 | #124 | Excellent 5.3% |
| Greeks | 80.4 /100 | #125 | Excellent 5.3% |
| Immigrants | Sri Lanka | 80.2 /100 | #126 | Excellent 5.3% |
| Taiwanese | 79.4 /100 | #127 | Good 5.3% |
Demographics Similar to Crow by Unemployment Among Ages 30 to 34 years
In terms of unemployment among ages 30 to 34 years, the demographic groups most similar to Crow are Navajo (10.6%, a difference of 2.0%), Yuman (10.6%, a difference of 2.4%), Inupiat (10.8%, a difference of 4.6%), Tohono O'odham (9.8%, a difference of 5.2%), and Yakama (9.8%, a difference of 6.0%).
| Demographics | Rating | Rank | Unemployment Among Ages 30 to 34 years |
| Pueblo | 0.0 /100 | #333 | Tragic 8.3% |
| Alaska Natives | 0.0 /100 | #334 | Tragic 8.5% |
| Puerto Ricans | 0.0 /100 | #335 | Tragic 8.9% |
| Colville | 0.0 /100 | #336 | Tragic 9.0% |
| Pima | 0.0 /100 | #337 | Tragic 9.6% |
| Yakama | 0.0 /100 | #338 | Tragic 9.8% |
| Tohono O'odham | 0.0 /100 | #339 | Tragic 9.8% |
| Crow | 0.0 /100 | #340 | Tragic 10.3% |
| Navajo | 0.0 /100 | #341 | Tragic 10.6% |
| Yuman | 0.0 /100 | #342 | Tragic 10.6% |
| Inupiat | 0.0 /100 | #343 | Tragic 10.8% |
| Hopi | 0.0 /100 | #344 | Tragic 11.9% |
| Arapaho | 0.0 /100 | #345 | Tragic 12.8% |
| Tsimshian | 0.0 /100 | #346 | Tragic 13.8% |
| Yup'ik | 0.0 /100 | #347 | Tragic 18.5% |