Immigrants from Poland vs Colville Unemployment Among Ages 60 to 64 years
COMPARE
Immigrants from Poland
Colville
Unemployment Among Ages 60 to 64 years
Unemployment Among Ages 60 to 64 years Comparison
Immigrants from Poland
Colville
5.0%
UNEMPLOYMENT AMONG AGES 60 TO 64 YEARS
3.0/ 100
METRIC RATING
238th/ 347
METRIC RANK
5.7%
UNEMPLOYMENT AMONG AGES 60 TO 64 YEARS
0.0/ 100
METRIC RATING
320th/ 347
METRIC RANK
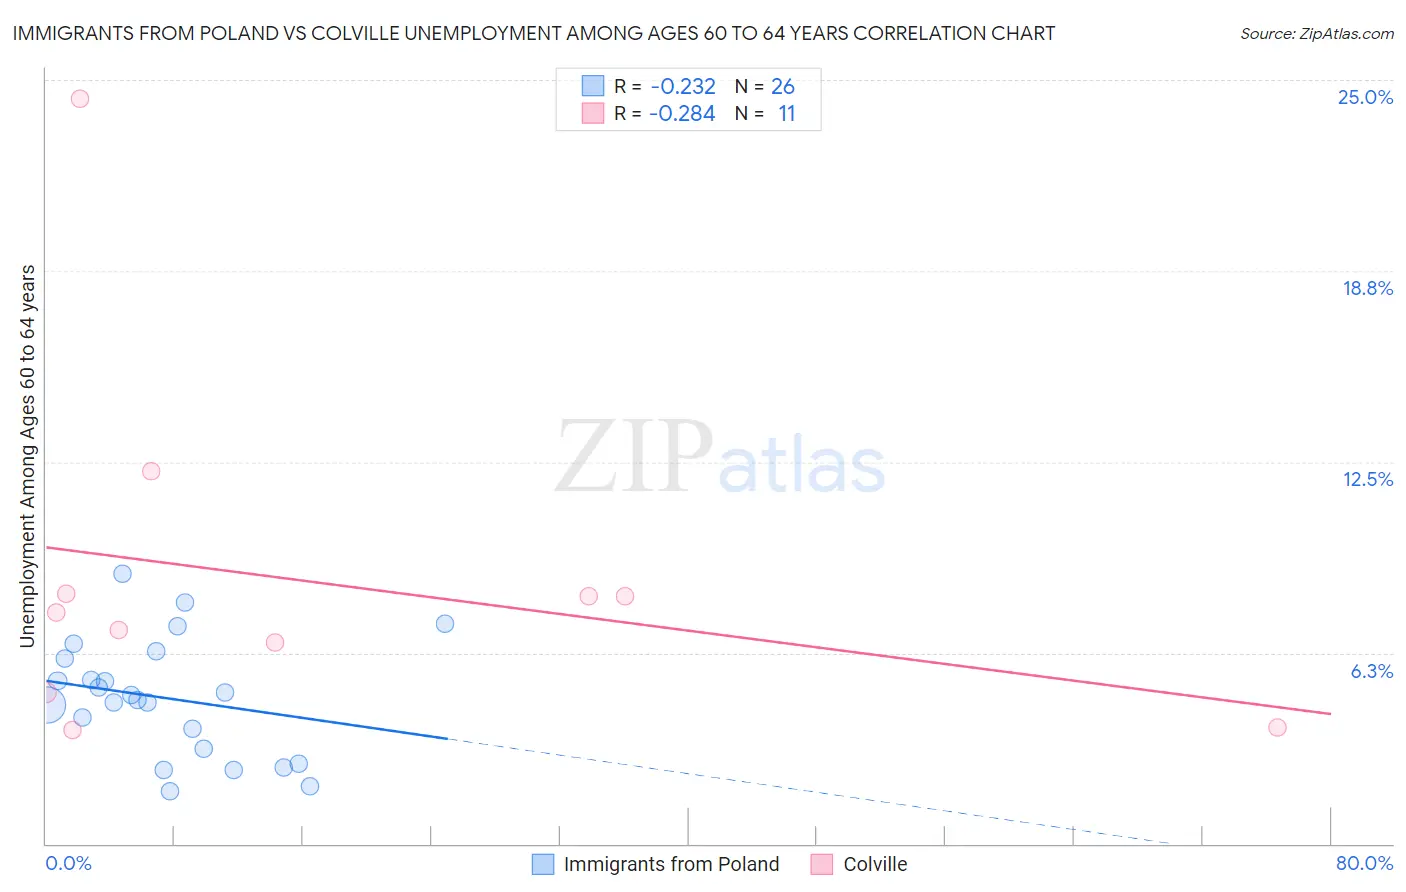
Immigrants from Poland vs Colville Unemployment Among Ages 60 to 64 years Correlation Chart
The statistical analysis conducted on geographies consisting of 283,702,985 people shows a weak negative correlation between the proportion of Immigrants from Poland and unemployment rate among population between the ages 60 and 64 in the United States with a correlation coefficient (R) of -0.232 and weighted average of 5.0%. Similarly, the statistical analysis conducted on geographies consisting of 33,432,651 people shows a weak negative correlation between the proportion of Colville and unemployment rate among population between the ages 60 and 64 in the United States with a correlation coefficient (R) of -0.284 and weighted average of 5.7%, a difference of 14.5%.
Unemployment Among Ages 60 to 64 years Correlation Summary
| Measurement | Immigrants from Poland | Colville |
| Minimum | 1.7% | 3.7% |
| Maximum | 8.8% | 24.4% |
| Range | 7.1% | 20.7% |
| Mean | 4.8% | 8.6% |
| Median | 4.8% | 7.6% |
| Interquartile 25% (IQ1) | 3.1% | 4.9% |
| Interquartile 75% (IQ3) | 6.1% | 8.2% |
| Interquartile Range (IQR) | 3.0% | 3.3% |
| Standard Deviation (Sample) | 1.9% | 5.8% |
| Standard Deviation (Population) | 1.9% | 5.5% |
Similar Demographics by Unemployment Among Ages 60 to 64 years
Demographics Similar to Immigrants from Poland by Unemployment Among Ages 60 to 64 years
In terms of unemployment among ages 60 to 64 years, the demographic groups most similar to Immigrants from Poland are Immigrants from Western Asia (5.0%, a difference of 0.0%), Immigrants from Sierra Leone (5.0%, a difference of 0.040%), Delaware (5.0%, a difference of 0.17%), Ghanaian (5.0%, a difference of 0.18%), and Immigrants from Croatia (5.0%, a difference of 0.25%).
| Demographics | Rating | Rank | Unemployment Among Ages 60 to 64 years |
| Tohono O'odham | 5.7 /100 | #231 | Tragic 5.0% |
| Immigrants | Eastern Asia | 4.7 /100 | #232 | Tragic 5.0% |
| Immigrants | Greece | 4.6 /100 | #233 | Tragic 5.0% |
| Iranians | 4.2 /100 | #234 | Tragic 5.0% |
| Delaware | 3.6 /100 | #235 | Tragic 5.0% |
| Immigrants | Sierra Leone | 3.1 /100 | #236 | Tragic 5.0% |
| Immigrants | Western Asia | 3.0 /100 | #237 | Tragic 5.0% |
| Immigrants | Poland | 3.0 /100 | #238 | Tragic 5.0% |
| Ghanaians | 2.4 /100 | #239 | Tragic 5.0% |
| Immigrants | Croatia | 2.2 /100 | #240 | Tragic 5.0% |
| Indians (Asian) | 2.2 /100 | #241 | Tragic 5.0% |
| Argentineans | 2.1 /100 | #242 | Tragic 5.0% |
| Immigrants | Philippines | 1.9 /100 | #243 | Tragic 5.0% |
| Peruvians | 1.6 /100 | #244 | Tragic 5.0% |
| Comanche | 1.3 /100 | #245 | Tragic 5.0% |
Demographics Similar to Colville by Unemployment Among Ages 60 to 64 years
In terms of unemployment among ages 60 to 64 years, the demographic groups most similar to Colville are Dutch West Indian (5.7%, a difference of 0.050%), Ecuadorian (5.8%, a difference of 0.44%), Immigrants from Belize (5.7%, a difference of 0.77%), Alsatian (5.8%, a difference of 1.1%), and Native/Alaskan (5.7%, a difference of 1.3%).
| Demographics | Rating | Rank | Unemployment Among Ages 60 to 64 years |
| Belizeans | 0.0 /100 | #313 | Tragic 5.5% |
| Guyanese | 0.0 /100 | #314 | Tragic 5.5% |
| Cree | 0.0 /100 | #315 | Tragic 5.6% |
| Cheyenne | 0.0 /100 | #316 | Tragic 5.6% |
| Shoshone | 0.0 /100 | #317 | Tragic 5.7% |
| Natives/Alaskans | 0.0 /100 | #318 | Tragic 5.7% |
| Immigrants | Belize | 0.0 /100 | #319 | Tragic 5.7% |
| Colville | 0.0 /100 | #320 | Tragic 5.7% |
| Dutch West Indians | 0.0 /100 | #321 | Tragic 5.7% |
| Ecuadorians | 0.0 /100 | #322 | Tragic 5.8% |
| Alsatians | 0.0 /100 | #323 | Tragic 5.8% |
| Immigrants | Ecuador | 0.0 /100 | #324 | Tragic 5.8% |
| Paiute | 0.0 /100 | #325 | Tragic 5.8% |
| Immigrants | St. Vincent and the Grenadines | 0.0 /100 | #326 | Tragic 5.9% |
| Immigrants | Grenada | 0.0 /100 | #327 | Tragic 5.9% |