Immigrants from Philippines vs Hispanic or Latino Unemployment Among Ages 60 to 64 years
COMPARE
Immigrants from Philippines
Hispanic or Latino
Unemployment Among Ages 60 to 64 years
Unemployment Among Ages 60 to 64 years Comparison
Immigrants from Philippines
Hispanics or Latinos
5.0%
UNEMPLOYMENT AMONG AGES 60 TO 64 YEARS
1.9/ 100
METRIC RATING
243rd/ 347
METRIC RANK
5.3%
UNEMPLOYMENT AMONG AGES 60 TO 64 YEARS
0.0/ 100
METRIC RATING
291st/ 347
METRIC RANK
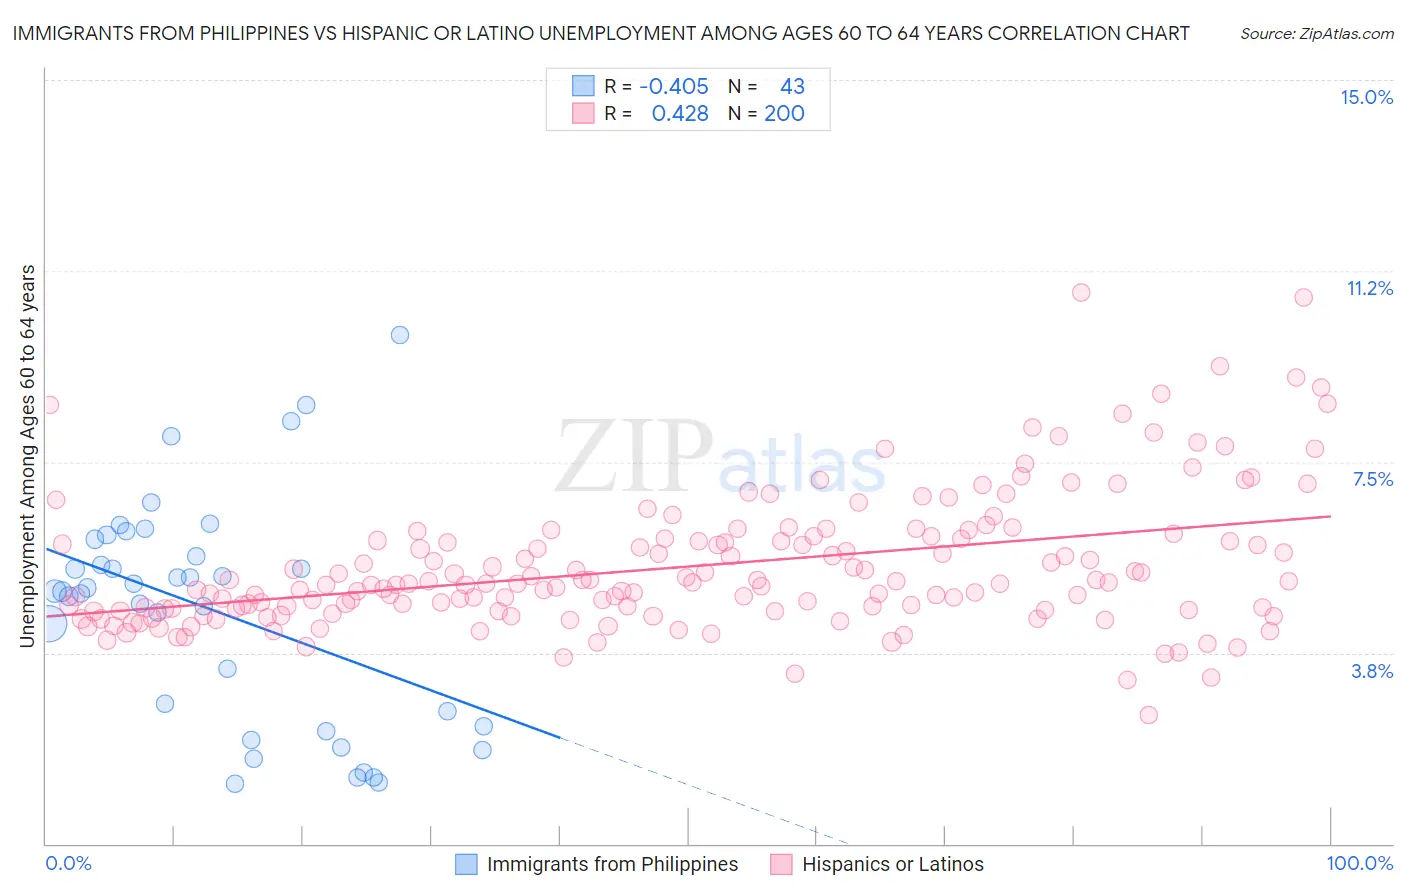
Immigrants from Philippines vs Hispanic or Latino Unemployment Among Ages 60 to 64 years Correlation Chart
The statistical analysis conducted on geographies consisting of 416,041,447 people shows a moderate negative correlation between the proportion of Immigrants from Philippines and unemployment rate among population between the ages 60 and 64 in the United States with a correlation coefficient (R) of -0.405 and weighted average of 5.0%. Similarly, the statistical analysis conducted on geographies consisting of 469,236,209 people shows a moderate positive correlation between the proportion of Hispanics or Latinos and unemployment rate among population between the ages 60 and 64 in the United States with a correlation coefficient (R) of 0.428 and weighted average of 5.3%, a difference of 5.6%.
Unemployment Among Ages 60 to 64 years Correlation Summary
| Measurement | Immigrants from Philippines | Hispanic or Latino |
| Minimum | 1.2% | 2.5% |
| Maximum | 10.0% | 10.8% |
| Range | 8.8% | 8.3% |
| Mean | 4.6% | 5.4% |
| Median | 5.0% | 5.1% |
| Interquartile 25% (IQ1) | 2.3% | 4.6% |
| Interquartile 75% (IQ3) | 6.0% | 6.0% |
| Interquartile Range (IQR) | 3.7% | 1.4% |
| Standard Deviation (Sample) | 2.2% | 1.3% |
| Standard Deviation (Population) | 2.2% | 1.3% |
Similar Demographics by Unemployment Among Ages 60 to 64 years
Demographics Similar to Immigrants from Philippines by Unemployment Among Ages 60 to 64 years
In terms of unemployment among ages 60 to 64 years, the demographic groups most similar to Immigrants from Philippines are Argentinean (5.0%, a difference of 0.10%), Peruvian (5.0%, a difference of 0.12%), Immigrants from Croatia (5.0%, a difference of 0.15%), Indian (Asian) (5.0%, a difference of 0.15%), and Ghanaian (5.0%, a difference of 0.23%).
| Demographics | Rating | Rank | Unemployment Among Ages 60 to 64 years |
| Immigrants | Sierra Leone | 3.1 /100 | #236 | Tragic 5.0% |
| Immigrants | Western Asia | 3.0 /100 | #237 | Tragic 5.0% |
| Immigrants | Poland | 3.0 /100 | #238 | Tragic 5.0% |
| Ghanaians | 2.4 /100 | #239 | Tragic 5.0% |
| Immigrants | Croatia | 2.2 /100 | #240 | Tragic 5.0% |
| Indians (Asian) | 2.2 /100 | #241 | Tragic 5.0% |
| Argentineans | 2.1 /100 | #242 | Tragic 5.0% |
| Immigrants | Philippines | 1.9 /100 | #243 | Tragic 5.0% |
| Peruvians | 1.6 /100 | #244 | Tragic 5.0% |
| Comanche | 1.3 /100 | #245 | Tragic 5.0% |
| Immigrants | South America | 1.1 /100 | #246 | Tragic 5.0% |
| Immigrants | North Macedonia | 1.1 /100 | #247 | Tragic 5.0% |
| Immigrants | Fiji | 1.1 /100 | #248 | Tragic 5.1% |
| South Americans | 1.0 /100 | #249 | Tragic 5.1% |
| Immigrants | Cambodia | 0.9 /100 | #250 | Tragic 5.1% |
Demographics Similar to Hispanics or Latinos by Unemployment Among Ages 60 to 64 years
In terms of unemployment among ages 60 to 64 years, the demographic groups most similar to Hispanics or Latinos are Immigrants from Latin America (5.3%, a difference of 0.020%), Immigrants from Israel (5.3%, a difference of 0.040%), Black/African American (5.3%, a difference of 0.15%), Armenian (5.3%, a difference of 0.18%), and Jamaican (5.3%, a difference of 0.30%).
| Demographics | Rating | Rank | Unemployment Among Ages 60 to 64 years |
| Taiwanese | 0.0 /100 | #284 | Tragic 5.3% |
| West Indians | 0.0 /100 | #285 | Tragic 5.3% |
| Mexican American Indians | 0.0 /100 | #286 | Tragic 5.3% |
| Salvadorans | 0.0 /100 | #287 | Tragic 5.3% |
| Trinidadians and Tobagonians | 0.0 /100 | #288 | Tragic 5.3% |
| Spanish Americans | 0.0 /100 | #289 | Tragic 5.3% |
| Immigrants | Trinidad and Tobago | 0.0 /100 | #290 | Tragic 5.3% |
| Hispanics or Latinos | 0.0 /100 | #291 | Tragic 5.3% |
| Immigrants | Latin America | 0.0 /100 | #292 | Tragic 5.3% |
| Immigrants | Israel | 0.0 /100 | #293 | Tragic 5.3% |
| Blacks/African Americans | 0.0 /100 | #294 | Tragic 5.3% |
| Armenians | 0.0 /100 | #295 | Tragic 5.3% |
| Jamaicans | 0.0 /100 | #296 | Tragic 5.3% |
| Osage | 0.0 /100 | #297 | Tragic 5.4% |
| Immigrants | Central America | 0.0 /100 | #298 | Tragic 5.4% |