Immigrants from Peru vs Immigrants from Belize Unemployment Among Youth under 25 years

COMPARE

Immigrants from Peru
Race
Ancestry
AfghanAfricanAlaska NativeAlaskan AthabascanAlbanianAleutAlsatianAmericanApacheArabArapahoArgentineanArmenianAssyrian/Chaldean/SyriacAustralianAustrianBahamianBangladeshiBarbadianBasqueBelgianBelizeanBermudanBhutaneseBlackfeetBolivianBrazilianBritishBritish West IndianBulgarianBurmeseCajunCambodianCanadianCape VerdeanCarpatho RusynCelticCentral AmericanCentral American IndianCherokeeCheyenneChickasawChileanChineseChippewaChoctawColombianColvilleComancheCosta RicanCreeCreekCroatianCrowCubanCypriotCzechCzechoslovakianDanishDelawareDominicanDutchDutch West IndianEastern EuropeanEcuadorianEgyptianEnglishEstonianEthiopianEuropeanFijianFilipinoFinnishFrenchFrench American IndianFrench CanadianGermanGerman RussianGhanaianGreekGuamanian/ChamorroGuatemalanGuyaneseHaitianHmongHonduranHopiHoumaHungarianIcelanderIndian (Asian)IndonesianInupiatIranianIraqiIrishIroquoisIsraeliItalianJamaicanJapaneseJordanianKenyanKiowaKoreanLaotianLatvianLebaneseLiberianLithuanianLumbeeLuxembourgerMacedonianMalaysianMalteseMarshalleseMenomineeMexicanMexican American IndianMongolianMoroccanNative HawaiianNavajoNepaleseNew ZealanderNicaraguanNigerianNorthern EuropeanNorwegianOkinawanOsageOttawaPaiutePakistaniPalestinianPanamanianParaguayanPennsylvania GermanPeruvianPimaPolishPortuguesePotawatomiPuebloPuerto RicanPuget Sound SalishRomanianRussianSalvadoranSamoanScandinavianScotch-IrishScottishSeminoleSenegaleseSerbianShoshoneSierra LeoneanSiouxSlavicSlovakSloveneSomaliSouth AfricanSouth AmericanSouth American IndianSoviet UnionSpaniardSpanishSpanish AmericanSpanish American IndianSri LankanSubsaharan AfricanSudaneseSwedishSwissSyrianTaiwaneseThaiTlingit-HaidaTohono O'OdhamTonganTrinidadian and TobagonianTsimshianTurkishU.S. Virgin IslanderUgandanUkrainianUruguayanUteVenezuelanVietnameseWelshWest IndianYakamaYaquiYugoslavianYumanYup'ikZimbabwean
Immigration
NonimmigrantsImmigrantsAfghanistanAfricaAlbaniaArgentinaArmeniaAsiaAustraliaAustriaBahamasBangladeshBarbadosBelarusBelgiumBoliviaBosnia and HerzegovinaBrazilBulgariaBurma/MyanmarCabo VerdeCambodiaCameroonCanadaCaribbeanCentral AmericaChileChinaColombiaCongoCosta RicaCroatiaCubaCzechoslovakiaDenmarkDominicaDominican RepublicEastern AfricaEastern AsiaEastern EuropeEcuadorEgyptEl SalvadorEnglandEritreaEthiopiaEuropeFijiFranceGermanyGhanaGreeceGrenadaGuatemalaGuyanaHaitiHondurasHong KongHungaryIndiaIndonesiaIranIraqIrelandIsraelItalyJamaicaJapanJordanKazakhstanKenyaKoreaKuwaitLaosLatin AmericaLatviaLebanonLiberiaLithuaniaMalaysiaMexicoMicronesiaMiddle AfricaMoldovaMoroccoNepalNetherlandsNicaraguaNigeriaNorth AmericaNorth MacedoniaNorthern AfricaNorthern EuropeNorwayOceaniaPakistanPanamaPeruPhilippinesPolandPortugalRomaniaRussiaSaudi ArabiaScotlandSenegalSerbiaSierra LeoneSingaporeSomaliaSouth AfricaSouth AmericaSouth Central AsiaSouth Eastern AsiaSouthern EuropeSpainSri LankaSt. Vincent and the GrenadinesSudanSwedenSwitzerlandSyriaTaiwanThailandTrinidad and TobagoTurkeyUgandaUkraineUruguayUzbekistanVenezuelaVietnamWest IndiesWestern AfricaWestern AsiaWestern EuropeYemenZaireZimbabweAzores
Immigrants from Belize
Race
Ancestry
AfghanAfricanAlaska NativeAlaskan AthabascanAlbanianAleutAlsatianAmericanApacheArabArapahoArgentineanArmenianAssyrian/Chaldean/SyriacAustralianAustrianBahamianBangladeshiBarbadianBasqueBelgianBelizeanBermudanBhutaneseBlackfeetBolivianBrazilianBritishBritish West IndianBulgarianBurmeseCajunCambodianCanadianCape VerdeanCarpatho RusynCelticCentral AmericanCentral American IndianCherokeeCheyenneChickasawChileanChineseChippewaChoctawColombianColvilleComancheCosta RicanCreeCreekCroatianCrowCubanCypriotCzechCzechoslovakianDanishDelawareDominicanDutchDutch West IndianEastern EuropeanEcuadorianEgyptianEnglishEstonianEthiopianEuropeanFijianFilipinoFinnishFrenchFrench American IndianFrench CanadianGermanGerman RussianGhanaianGreekGuamanian/ChamorroGuatemalanGuyaneseHaitianHmongHonduranHopiHoumaHungarianIcelanderIndian (Asian)IndonesianInupiatIranianIraqiIrishIroquoisIsraeliItalianJamaicanJapaneseJordanianKenyanKiowaKoreanLaotianLatvianLebaneseLiberianLithuanianLumbeeLuxembourgerMacedonianMalaysianMalteseMarshalleseMenomineeMexicanMexican American IndianMongolianMoroccanNative HawaiianNavajoNepaleseNew ZealanderNicaraguanNigerianNorthern EuropeanNorwegianOkinawanOsageOttawaPaiutePakistaniPalestinianPanamanianParaguayanPennsylvania GermanPeruvianPimaPolishPortuguesePotawatomiPuebloPuerto RicanPuget Sound SalishRomanianRussianSalvadoranSamoanScandinavianScotch-IrishScottishSeminoleSenegaleseSerbianShoshoneSierra LeoneanSiouxSlavicSlovakSloveneSomaliSouth AfricanSouth AmericanSouth American IndianSoviet UnionSpaniardSpanishSpanish AmericanSpanish American IndianSri LankanSubsaharan AfricanSudaneseSwedishSwissSyrianTaiwaneseThaiTlingit-HaidaTohono O'OdhamTonganTrinidadian and TobagonianTsimshianTurkishU.S. Virgin IslanderUgandanUkrainianUruguayanUteVenezuelanVietnameseWelshWest IndianYakamaYaquiYugoslavianYumanYup'ikZimbabwean
Immigration
NonimmigrantsImmigrantsAfghanistanAfricaAlbaniaArgentinaArmeniaAsiaAustraliaAustriaBahamasBangladeshBarbadosBelarusBelgiumBelizeBoliviaBosnia and HerzegovinaBrazilBulgariaBurma/MyanmarCabo VerdeCambodiaCameroonCanadaCaribbeanCentral AmericaChileChinaColombiaCongoCosta RicaCroatiaCubaCzechoslovakiaDenmarkDominicaDominican RepublicEastern AfricaEastern AsiaEastern EuropeEcuadorEgyptEl SalvadorEnglandEritreaEthiopiaEuropeFijiFranceGermanyGhanaGreeceGrenadaGuatemalaGuyanaHaitiHondurasHong KongHungaryIndiaIndonesiaIranIraqIrelandIsraelItalyJamaicaJapanJordanKazakhstanKenyaKoreaKuwaitLaosLatin AmericaLatviaLebanonLiberiaLithuaniaMalaysiaMexicoMicronesiaMiddle AfricaMoldovaMoroccoNepalNetherlandsNicaraguaNigeriaNorth AmericaNorth MacedoniaNorthern AfricaNorthern EuropeNorwayOceaniaPakistanPanamaPhilippinesPolandPortugalRomaniaRussiaSaudi ArabiaScotlandSenegalSerbiaSierra LeoneSingaporeSomaliaSouth AfricaSouth AmericaSouth Central AsiaSouth Eastern AsiaSouthern EuropeSpainSri LankaSt. Vincent and the GrenadinesSudanSwedenSwitzerlandSyriaTaiwanThailandTrinidad and TobagoTurkeyUgandaUkraineUruguayUzbekistanVenezuelaVietnamWest IndiesWestern AfricaWestern AsiaWestern EuropeYemenZaireZimbabweAzores
Unemployment Among Youth under 25 years
Income
Poverty
Unemployment
Labor Participation
Family Structure
Vehicle Availability
Education Level
Disability

Unemployment Among Youth under 25 years Comparison

Immigrants from Peru

Immigrants from Belize

Poor
Tragic
11.8%
UNEMPLOYMENT AMONG YOUTH UNDER 25 YEARS
15.3/ 100
METRIC RATING
203rd/ 347
METRIC RANK
14.0%
UNEMPLOYMENT AMONG YOUTH UNDER 25 YEARS
0.0/ 100
METRIC RATING
308th/ 347
METRIC RANK

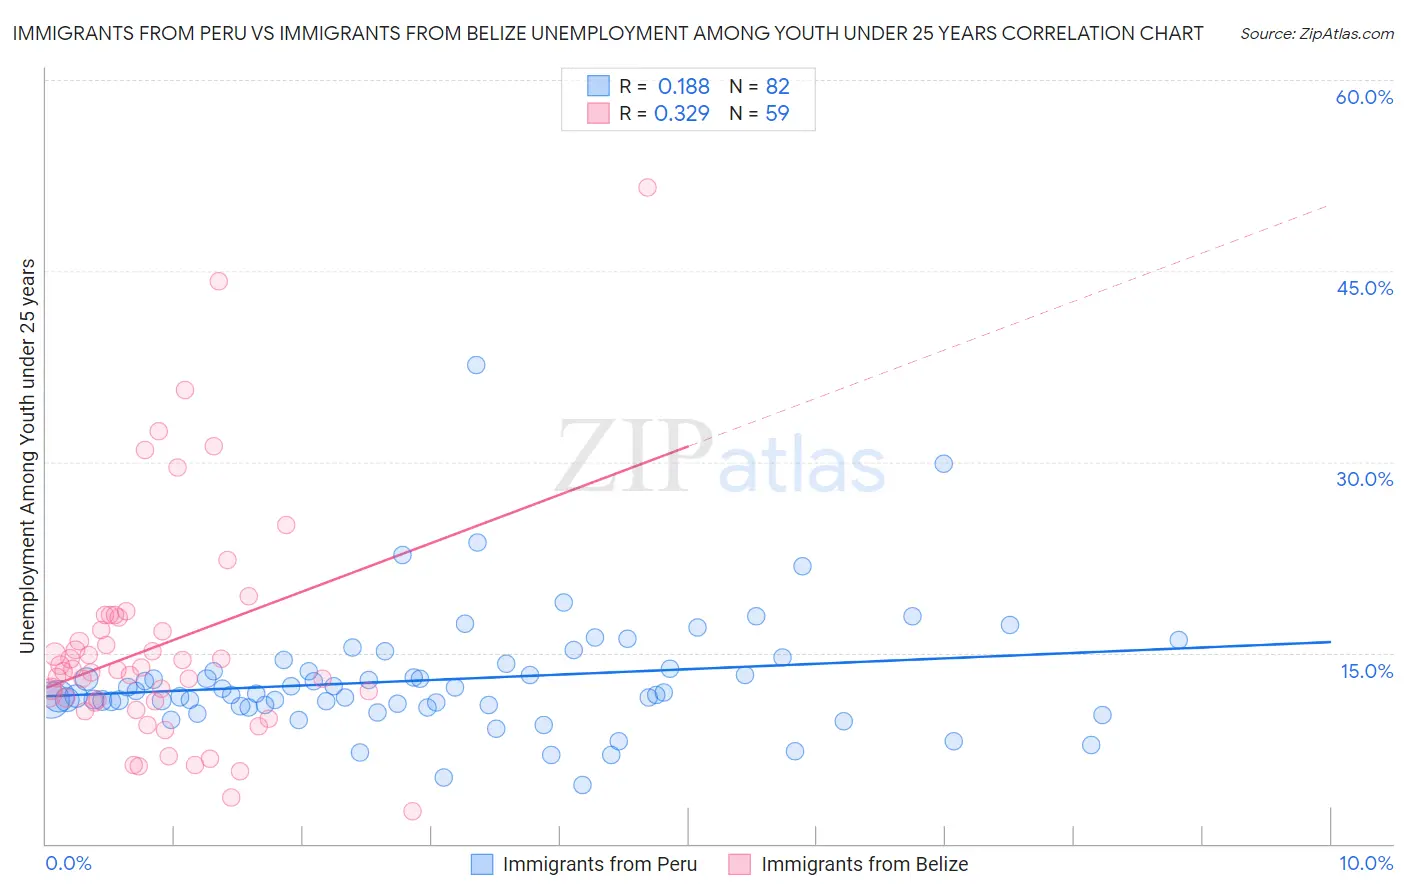
Immigrants from Peru vs Immigrants from Belize Unemployment Among Youth under 25 years Correlation Chart

The statistical analysis conducted on geographies consisting of 326,420,318 people shows a poor positive correlation between the proportion of Immigrants from Peru and unemployment rate among youth under the age of 25 in the United States with a correlation coefficient (R) of 0.188 and weighted average of 11.8%. Similarly, the statistical analysis conducted on geographies consisting of 129,930,748 people shows a mild positive correlation between the proportion of Immigrants from Belize and unemployment rate among youth under the age of 25 in the United States with a correlation coefficient (R) of 0.329 and weighted average of 14.0%, a difference of 18.6%.
Immigrants from Peru vs Immigrants from Belize Unemployment Among Youth under 25 years

Unemployment Among Youth under 25 years Correlation Summary

MeasurementImmigrants from PeruImmigrants from Belize
Minimum4.6%2.6%
Maximum37.6%51.6%
Range33.0%49.0%
Mean12.9%15.7%
Median11.8%13.7%
Interquartile 25% (IQ1)10.9%11.1%
Interquartile 75% (IQ3)13.7%17.7%
Interquartile Range (IQR)2.8%6.7%
Standard Deviation (Sample)4.8%9.2%
Standard Deviation (Population)4.8%9.1%

Similar Demographics by Unemployment Among Youth under 25 years

Demographics Similar to Immigrants from Peru by Unemployment Among Youth under 25 years

In terms of unemployment among youth under 25 years, the demographic groups most similar to Immigrants from Peru are Immigrants from Costa Rica (11.8%, a difference of 0.010%), Marshallese (11.8%, a difference of 0.040%), Palestinian (11.8%, a difference of 0.050%), Peruvian (11.8%, a difference of 0.10%), and Arab (11.8%, a difference of 0.20%).
DemographicsRating | RankUnemployment Among Youth under 25 years
Egyptians
26.9
/100
|
#196
Fair
11.7%
Koreans
23.9
/100
|
#197
Fair
11.7%
Cherokee
21.2
/100
|
#198
Fair
11.8%
Immigrants | Colombia
20.9
/100
|
#199
Fair
11.8%
Arabs
18.0
/100
|
#200
Poor
11.8%
Palestinians
16.0
/100
|
#201
Poor
11.8%
Marshallese
15.8
/100
|
#202
Poor
11.8%
Immigrants | Peru
15.3
/100
|
#203
Poor
11.8%
Immigrants | Costa Rica
15.2
/100
|
#204
Poor
11.8%
Peruvians
14.0
/100
|
#205
Poor
11.8%
Immigrants | Pakistan
12.6
/100
|
#206
Poor
11.8%
Immigrants | Southern Europe
12.3
/100
|
#207
Poor
11.8%
Comanche
12.1
/100
|
#208
Poor
11.8%
Immigrants | Lebanon
11.3
/100
|
#209
Poor
11.8%
Assyrians/Chaldeans/Syriacs
9.8
/100
|
#210
Tragic
11.9%

Demographics Similar to Immigrants from Belize by Unemployment Among Youth under 25 years

In terms of unemployment among youth under 25 years, the demographic groups most similar to Immigrants from Belize are Immigrants from Haiti (14.0%, a difference of 0.38%), Aleut (14.1%, a difference of 0.86%), Pueblo (13.9%, a difference of 0.87%), Haitian (13.9%, a difference of 0.94%), and Houma (13.8%, a difference of 1.3%).
DemographicsRating | RankUnemployment Among Youth under 25 years
Immigrants | Senegal
0.0
/100
|
#301
Tragic
13.8%
Immigrants | Sierra Leone
0.0
/100
|
#302
Tragic
13.8%
Belizeans
0.0
/100
|
#303
Tragic
13.8%
Houma
0.0
/100
|
#304
Tragic
13.8%
Haitians
0.0
/100
|
#305
Tragic
13.9%
Pueblo
0.0
/100
|
#306
Tragic
13.9%
Immigrants | Haiti
0.0
/100
|
#307
Tragic
14.0%
Immigrants | Belize
0.0
/100
|
#308
Tragic
14.0%
Aleuts
0.0
/100
|
#309
Tragic
14.1%
Immigrants | West Indies
0.0
/100
|
#310
Tragic
14.2%
Immigrants | Bangladesh
0.0
/100
|
#311
Tragic
14.2%
Vietnamese
0.0
/100
|
#312
Tragic
14.3%
Immigrants | Armenia
0.0
/100
|
#313
Tragic
14.4%
Jamaicans
0.0
/100
|
#314
Tragic
14.4%
Sioux
0.0
/100
|
#315
Tragic
14.4%