Immigrants from Peru vs Central American Unemployment Among Ages 30 to 34 years
COMPARE
Immigrants from Peru
Central American
Unemployment Among Ages 30 to 34 years
Unemployment Among Ages 30 to 34 years Comparison
Immigrants from Peru
Central Americans
5.5%
UNEMPLOYMENT AMONG AGES 30 TO 34 YEARS
48.0/ 100
METRIC RATING
176th/ 347
METRIC RANK
5.9%
UNEMPLOYMENT AMONG AGES 30 TO 34 YEARS
0.6/ 100
METRIC RATING
237th/ 347
METRIC RANK
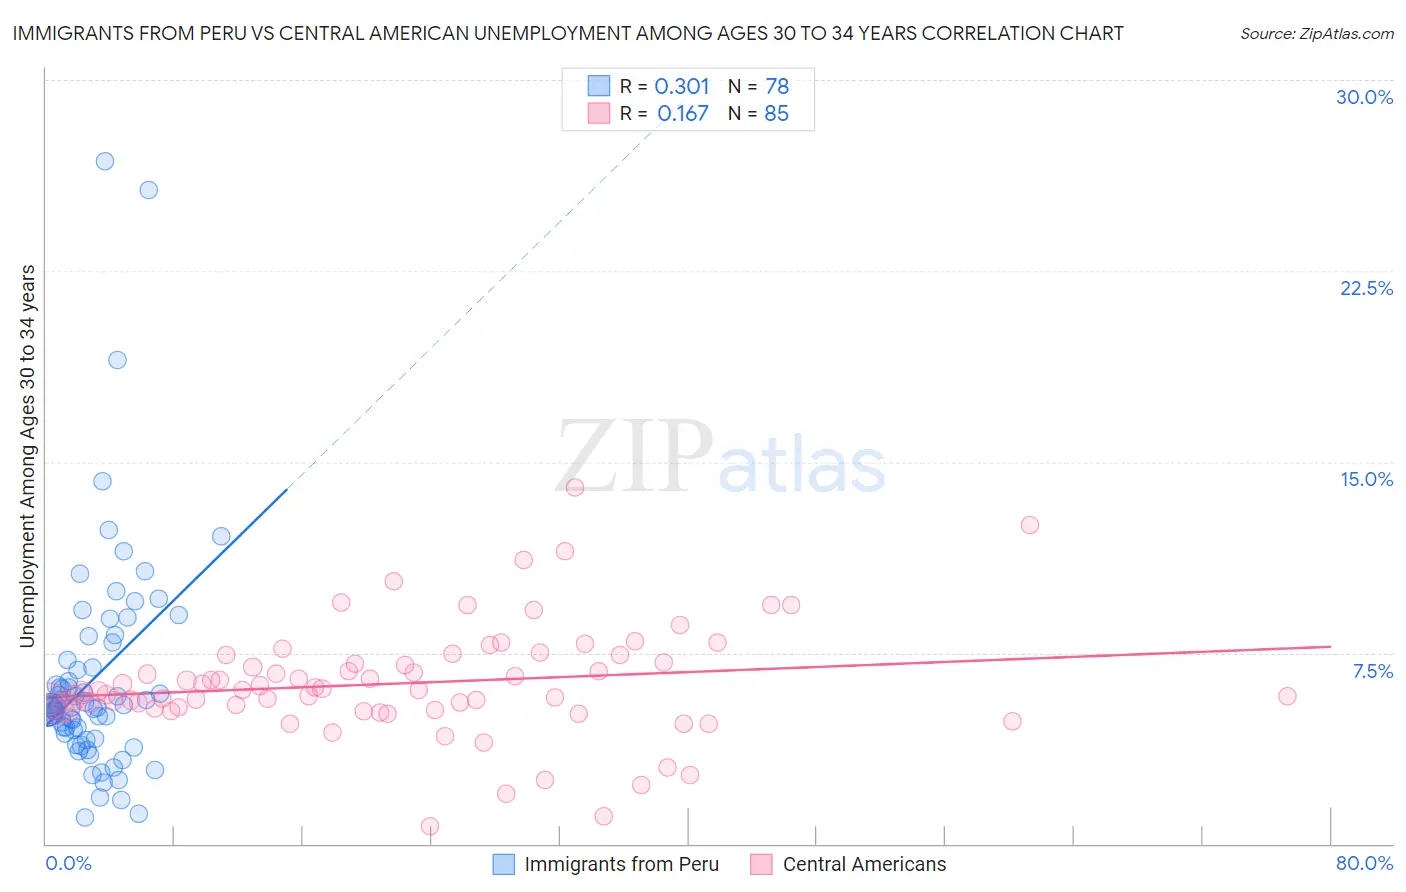
Immigrants from Peru vs Central American Unemployment Among Ages 30 to 34 years Correlation Chart
The statistical analysis conducted on geographies consisting of 315,910,797 people shows a mild positive correlation between the proportion of Immigrants from Peru and unemployment rate among population between the ages 30 and 34 in the United States with a correlation coefficient (R) of 0.301 and weighted average of 5.5%. Similarly, the statistical analysis conducted on geographies consisting of 462,932,276 people shows a poor positive correlation between the proportion of Central Americans and unemployment rate among population between the ages 30 and 34 in the United States with a correlation coefficient (R) of 0.167 and weighted average of 5.9%, a difference of 8.7%.
Unemployment Among Ages 30 to 34 years Correlation Summary
| Measurement | Immigrants from Peru | Central American |
| Minimum | 1.1% | 0.70% |
| Maximum | 26.8% | 14.0% |
| Range | 25.7% | 13.3% |
| Mean | 6.5% | 6.3% |
| Median | 5.4% | 6.0% |
| Interquartile 25% (IQ1) | 4.3% | 5.3% |
| Interquartile 75% (IQ3) | 7.2% | 7.3% |
| Interquartile Range (IQR) | 2.9% | 2.0% |
| Standard Deviation (Sample) | 4.4% | 2.2% |
| Standard Deviation (Population) | 4.4% | 2.2% |
Similar Demographics by Unemployment Among Ages 30 to 34 years
Demographics Similar to Immigrants from Peru by Unemployment Among Ages 30 to 34 years
In terms of unemployment among ages 30 to 34 years, the demographic groups most similar to Immigrants from Peru are Immigrants from Ukraine (5.5%, a difference of 0.020%), Macedonian (5.5%, a difference of 0.070%), Costa Rican (5.5%, a difference of 0.090%), Afghan (5.5%, a difference of 0.11%), and Immigrants from Laos (5.5%, a difference of 0.14%).
| Demographics | Rating | Rank | Unemployment Among Ages 30 to 34 years |
| Immigrants | Israel | 52.9 /100 | #169 | Average 5.4% |
| Dutch | 52.6 /100 | #170 | Average 5.5% |
| Scottish | 51.8 /100 | #171 | Average 5.5% |
| Immigrants | Austria | 51.3 /100 | #172 | Average 5.5% |
| Peruvians | 50.2 /100 | #173 | Average 5.5% |
| Immigrants | Laos | 50.0 /100 | #174 | Average 5.5% |
| Afghans | 49.6 /100 | #175 | Average 5.5% |
| Immigrants | Peru | 48.0 /100 | #176 | Average 5.5% |
| Immigrants | Ukraine | 47.7 /100 | #177 | Average 5.5% |
| Macedonians | 47.1 /100 | #178 | Average 5.5% |
| Costa Ricans | 46.7 /100 | #179 | Average 5.5% |
| Italians | 45.5 /100 | #180 | Average 5.5% |
| Immigrants | Lebanon | 43.5 /100 | #181 | Average 5.5% |
| Immigrants | Denmark | 43.4 /100 | #182 | Average 5.5% |
| Hungarians | 43.1 /100 | #183 | Average 5.5% |
Demographics Similar to Central Americans by Unemployment Among Ages 30 to 34 years
In terms of unemployment among ages 30 to 34 years, the demographic groups most similar to Central Americans are Mexican American Indian (5.9%, a difference of 0.090%), Native Hawaiian (5.9%, a difference of 0.17%), Immigrants from Nigeria (6.0%, a difference of 0.17%), Yaqui (5.9%, a difference of 0.29%), and Portuguese (5.9%, a difference of 0.41%).
| Demographics | Rating | Rank | Unemployment Among Ages 30 to 34 years |
| Hawaiians | 1.2 /100 | #230 | Tragic 5.9% |
| Japanese | 1.1 /100 | #231 | Tragic 5.9% |
| Iroquois | 1.0 /100 | #232 | Tragic 5.9% |
| Nepalese | 0.8 /100 | #233 | Tragic 5.9% |
| Portuguese | 0.8 /100 | #234 | Tragic 5.9% |
| Yaqui | 0.7 /100 | #235 | Tragic 5.9% |
| Native Hawaiians | 0.7 /100 | #236 | Tragic 5.9% |
| Central Americans | 0.6 /100 | #237 | Tragic 5.9% |
| Mexican American Indians | 0.6 /100 | #238 | Tragic 5.9% |
| Immigrants | Nigeria | 0.6 /100 | #239 | Tragic 6.0% |
| Salvadorans | 0.5 /100 | #240 | Tragic 6.0% |
| Immigrants | El Salvador | 0.5 /100 | #241 | Tragic 6.0% |
| Guatemalans | 0.4 /100 | #242 | Tragic 6.0% |
| Immigrants | Liberia | 0.4 /100 | #243 | Tragic 6.0% |
| Immigrants | Micronesia | 0.3 /100 | #244 | Tragic 6.0% |