Immigrants from Panama vs Belizean Unemployment Among Women with Children Under 18 years
COMPARE
Immigrants from Panama
Belizean
Unemployment Among Women with Children Under 18 years
Unemployment Among Women with Children Under 18 years Comparison
Immigrants from Panama
Belizeans
5.8%
UNEMPLOYMENT AMONG WOMEN WITH CHILDREN UNDER 18 YEARS
3.4/ 100
METRIC RATING
229th/ 347
METRIC RANK
6.5%
UNEMPLOYMENT AMONG WOMEN WITH CHILDREN UNDER 18 YEARS
0.0/ 100
METRIC RATING
307th/ 347
METRIC RANK
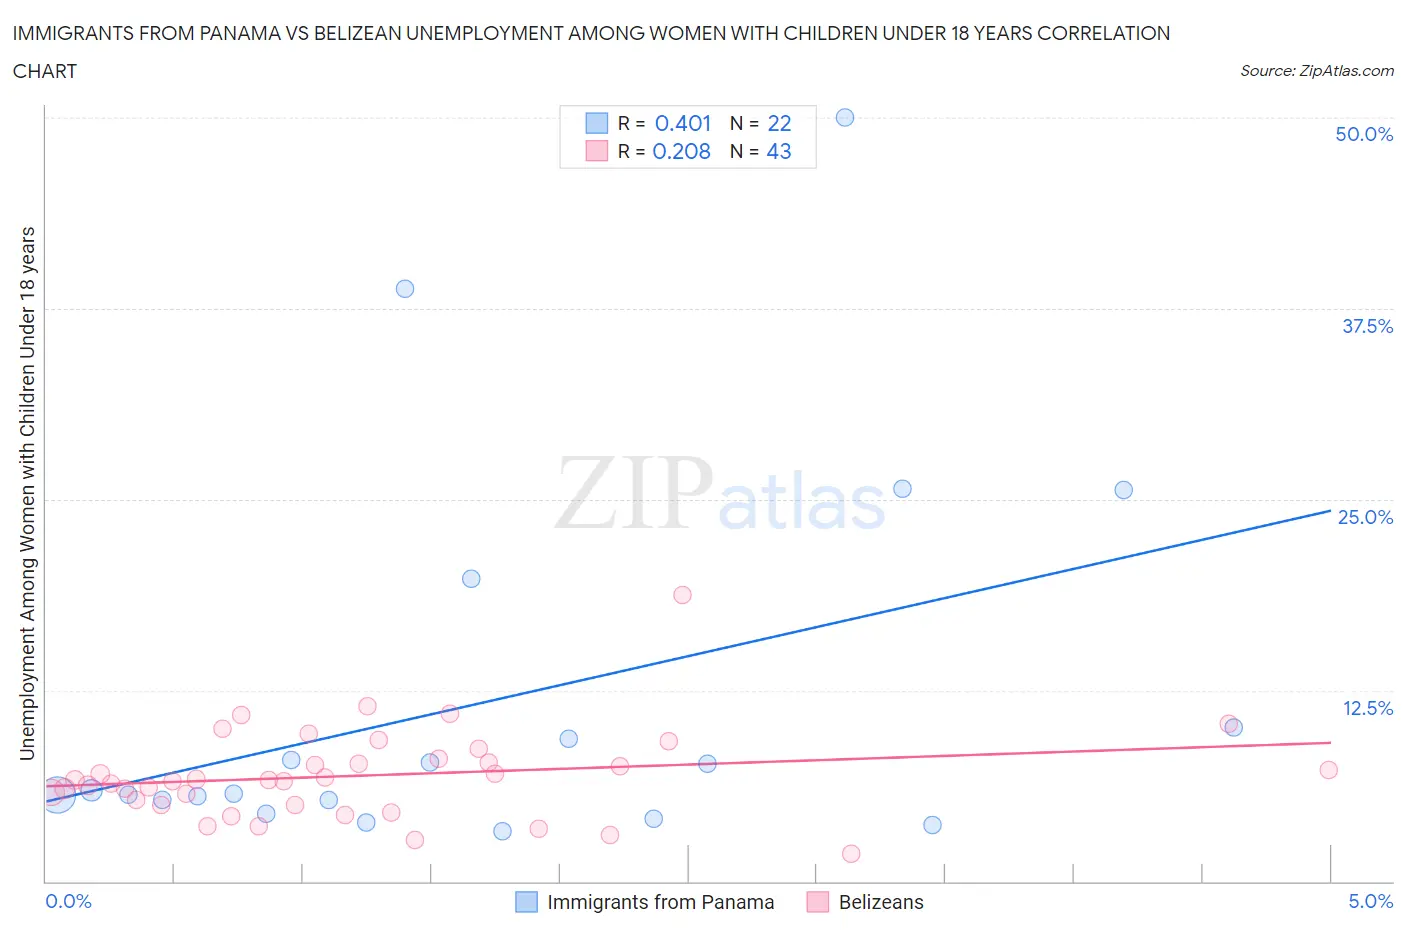
Immigrants from Panama vs Belizean Unemployment Among Women with Children Under 18 years Correlation Chart
The statistical analysis conducted on geographies consisting of 217,722,882 people shows a moderate positive correlation between the proportion of Immigrants from Panama and unemployment rate among women with children under the age of 18 in the United States with a correlation coefficient (R) of 0.401 and weighted average of 5.8%. Similarly, the statistical analysis conducted on geographies consisting of 142,666,018 people shows a weak positive correlation between the proportion of Belizeans and unemployment rate among women with children under the age of 18 in the United States with a correlation coefficient (R) of 0.208 and weighted average of 6.5%, a difference of 13.0%.
Unemployment Among Women with Children Under 18 years Correlation Summary
| Measurement | Immigrants from Panama | Belizean |
| Minimum | 3.3% | 1.8% |
| Maximum | 50.0% | 18.8% |
| Range | 46.7% | 17.0% |
| Mean | 11.9% | 6.9% |
| Median | 5.8% | 6.6% |
| Interquartile 25% (IQ1) | 5.3% | 5.0% |
| Interquartile 75% (IQ3) | 10.1% | 8.0% |
| Interquartile Range (IQR) | 4.8% | 3.0% |
| Standard Deviation (Sample) | 12.5% | 3.0% |
| Standard Deviation (Population) | 12.2% | 2.9% |
Similar Demographics by Unemployment Among Women with Children Under 18 years
Demographics Similar to Immigrants from Panama by Unemployment Among Women with Children Under 18 years
In terms of unemployment among women with children under 18 years, the demographic groups most similar to Immigrants from Panama are Immigrants from South America (5.8%, a difference of 0.060%), Somali (5.8%, a difference of 0.090%), Immigrants from Africa (5.8%, a difference of 0.12%), Creek (5.8%, a difference of 0.15%), and Spanish American (5.8%, a difference of 0.17%).
| Demographics | Rating | Rank | Unemployment Among Women with Children Under 18 years |
| Osage | 5.0 /100 | #222 | Tragic 5.7% |
| Potawatomi | 5.0 /100 | #223 | Tragic 5.7% |
| Immigrants | Syria | 4.6 /100 | #224 | Tragic 5.7% |
| Armenians | 4.5 /100 | #225 | Tragic 5.7% |
| Cherokee | 4.3 /100 | #226 | Tragic 5.7% |
| Sierra Leoneans | 3.8 /100 | #227 | Tragic 5.8% |
| Somalis | 3.5 /100 | #228 | Tragic 5.8% |
| Immigrants | Panama | 3.4 /100 | #229 | Tragic 5.8% |
| Immigrants | South America | 3.2 /100 | #230 | Tragic 5.8% |
| Immigrants | Africa | 3.1 /100 | #231 | Tragic 5.8% |
| Creek | 3.1 /100 | #232 | Tragic 5.8% |
| Spanish Americans | 3.1 /100 | #233 | Tragic 5.8% |
| Guamanians/Chamorros | 2.9 /100 | #234 | Tragic 5.8% |
| Immigrants | Middle Africa | 2.8 /100 | #235 | Tragic 5.8% |
| Alsatians | 2.5 /100 | #236 | Tragic 5.8% |
Demographics Similar to Belizeans by Unemployment Among Women with Children Under 18 years
In terms of unemployment among women with children under 18 years, the demographic groups most similar to Belizeans are Immigrants from Guyana (6.5%, a difference of 0.070%), Immigrants from Central America (6.5%, a difference of 0.12%), African (6.5%, a difference of 0.22%), Ecuadorian (6.5%, a difference of 0.31%), and Guyanese (6.6%, a difference of 0.55%).
| Demographics | Rating | Rank | Unemployment Among Women with Children Under 18 years |
| Immigrants | Jamaica | 0.0 /100 | #300 | Tragic 6.4% |
| Immigrants | Haiti | 0.0 /100 | #301 | Tragic 6.4% |
| Immigrants | Armenia | 0.0 /100 | #302 | Tragic 6.5% |
| Immigrants | Honduras | 0.0 /100 | #303 | Tragic 6.5% |
| Vietnamese | 0.0 /100 | #304 | Tragic 6.5% |
| Immigrants | Central America | 0.0 /100 | #305 | Tragic 6.5% |
| Immigrants | Guyana | 0.0 /100 | #306 | Tragic 6.5% |
| Belizeans | 0.0 /100 | #307 | Tragic 6.5% |
| Africans | 0.0 /100 | #308 | Tragic 6.5% |
| Ecuadorians | 0.0 /100 | #309 | Tragic 6.5% |
| Guyanese | 0.0 /100 | #310 | Tragic 6.6% |
| Yaqui | 0.0 /100 | #311 | Tragic 6.6% |
| Immigrants | Mexico | 0.0 /100 | #312 | Tragic 6.6% |
| Hispanics or Latinos | 0.0 /100 | #313 | Tragic 6.6% |
| British West Indians | 0.0 /100 | #314 | Tragic 6.6% |