Immigrants from Pakistan vs Yugoslavian Male Unemployment
COMPARE
Immigrants from Pakistan
Yugoslavian
Male Unemployment
Male Unemployment Comparison
Immigrants from Pakistan
Yugoslavians
5.1%
MALE UNEMPLOYMENT
90.9/ 100
METRIC RATING
109th/ 347
METRIC RANK
5.0%
MALE UNEMPLOYMENT
98.7/ 100
METRIC RATING
54th/ 347
METRIC RANK
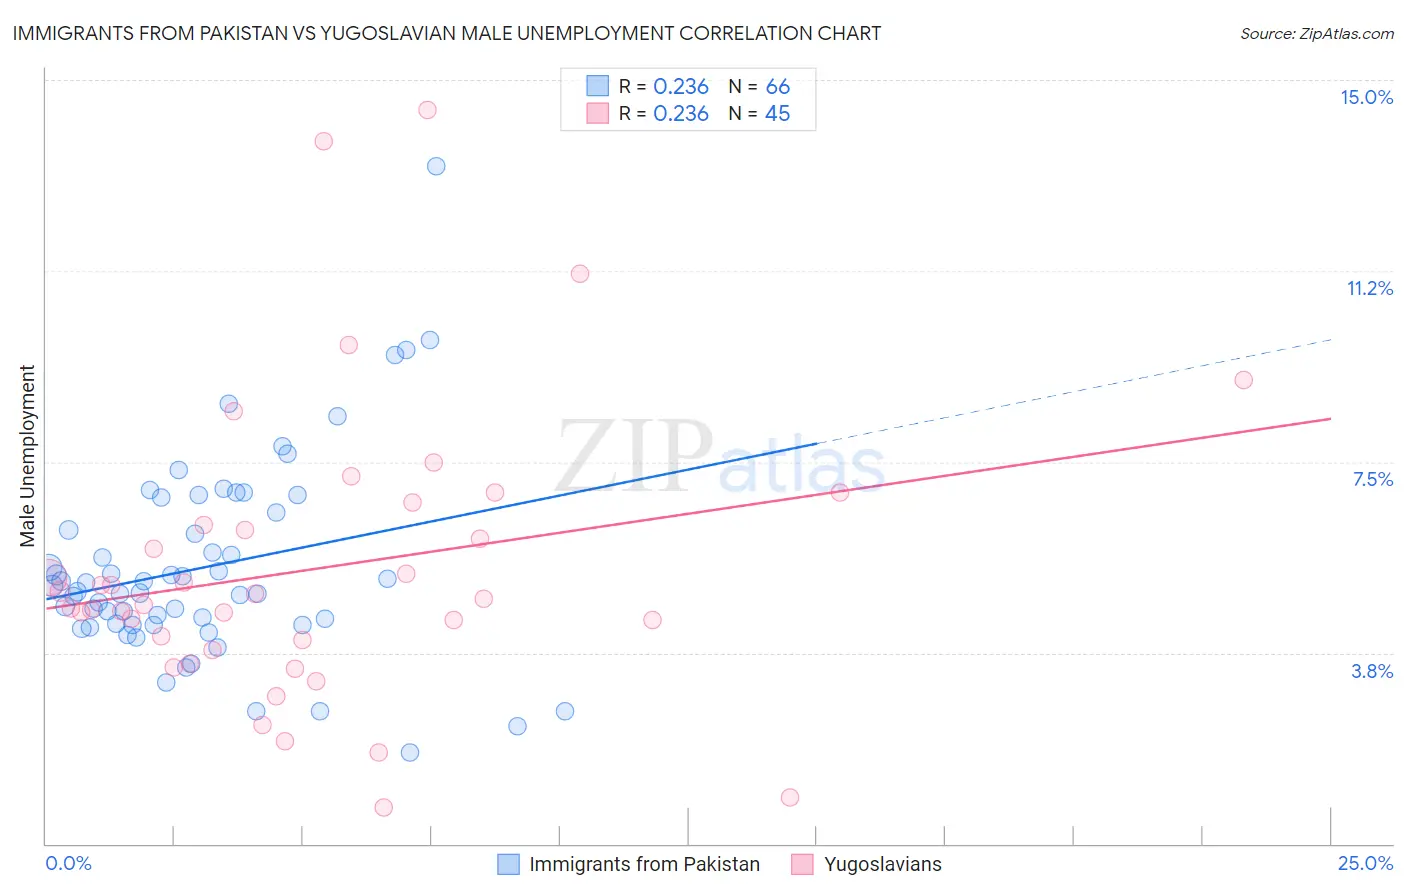
Immigrants from Pakistan vs Yugoslavian Male Unemployment Correlation Chart
The statistical analysis conducted on geographies consisting of 283,399,796 people shows a weak positive correlation between the proportion of Immigrants from Pakistan and unemployment rate among males in the United States with a correlation coefficient (R) of 0.236 and weighted average of 5.1%. Similarly, the statistical analysis conducted on geographies consisting of 284,881,859 people shows a weak positive correlation between the proportion of Yugoslavians and unemployment rate among males in the United States with a correlation coefficient (R) of 0.236 and weighted average of 5.0%, a difference of 3.2%.
Male Unemployment Correlation Summary
| Measurement | Immigrants from Pakistan | Yugoslavian |
| Minimum | 1.8% | 0.70% |
| Maximum | 13.3% | 14.4% |
| Range | 11.5% | 13.7% |
| Mean | 5.4% | 5.4% |
| Median | 5.0% | 4.8% |
| Interquartile 25% (IQ1) | 4.3% | 3.9% |
| Interquartile 75% (IQ3) | 6.5% | 6.5% |
| Interquartile Range (IQR) | 2.2% | 2.6% |
| Standard Deviation (Sample) | 2.0% | 2.8% |
| Standard Deviation (Population) | 2.0% | 2.8% |
Similar Demographics by Male Unemployment
Demographics Similar to Immigrants from Pakistan by Male Unemployment
In terms of male unemployment, the demographic groups most similar to Immigrants from Pakistan are Immigrants from England (5.1%, a difference of 0.020%), Immigrants from Eastern Asia (5.1%, a difference of 0.030%), Immigrants from Nicaragua (5.1%, a difference of 0.060%), Ethiopian (5.1%, a difference of 0.070%), and Immigrants from Ethiopia (5.1%, a difference of 0.11%).
| Demographics | Rating | Rank | Male Unemployment |
| Immigrants | France | 92.7 /100 | #102 | Exceptional 5.1% |
| Immigrants | Jordan | 91.9 /100 | #103 | Exceptional 5.1% |
| Immigrants | Chile | 91.8 /100 | #104 | Exceptional 5.1% |
| Immigrants | Czechoslovakia | 91.7 /100 | #105 | Exceptional 5.1% |
| Immigrants | Ethiopia | 91.5 /100 | #106 | Exceptional 5.1% |
| Ethiopians | 91.3 /100 | #107 | Exceptional 5.1% |
| Immigrants | Nicaragua | 91.2 /100 | #108 | Exceptional 5.1% |
| Immigrants | Pakistan | 90.9 /100 | #109 | Exceptional 5.1% |
| Immigrants | England | 90.8 /100 | #110 | Exceptional 5.1% |
| Immigrants | Eastern Asia | 90.8 /100 | #111 | Exceptional 5.1% |
| Immigrants | Moldova | 90.3 /100 | #112 | Exceptional 5.1% |
| Immigrants | Austria | 90.3 /100 | #113 | Exceptional 5.1% |
| Romanians | 89.8 /100 | #114 | Excellent 5.1% |
| Immigrants | Asia | 89.6 /100 | #115 | Excellent 5.1% |
| Immigrants | Denmark | 89.4 /100 | #116 | Excellent 5.1% |
Demographics Similar to Yugoslavians by Male Unemployment
In terms of male unemployment, the demographic groups most similar to Yugoslavians are Czechoslovakian (5.0%, a difference of 0.0%), Immigrants from Bulgaria (5.0%, a difference of 0.010%), Jordanian (5.0%, a difference of 0.10%), Irish (5.0%, a difference of 0.16%), and Slovene (5.0%, a difference of 0.18%).
| Demographics | Rating | Rank | Male Unemployment |
| Austrians | 98.9 /100 | #47 | Exceptional 4.9% |
| Immigrants | Scotland | 98.9 /100 | #48 | Exceptional 4.9% |
| Poles | 98.9 /100 | #49 | Exceptional 4.9% |
| Croatians | 98.9 /100 | #50 | Exceptional 4.9% |
| Slovenes | 98.8 /100 | #51 | Exceptional 5.0% |
| Irish | 98.8 /100 | #52 | Exceptional 5.0% |
| Jordanians | 98.8 /100 | #53 | Exceptional 5.0% |
| Yugoslavians | 98.7 /100 | #54 | Exceptional 5.0% |
| Czechoslovakians | 98.7 /100 | #55 | Exceptional 5.0% |
| Immigrants | Bulgaria | 98.7 /100 | #56 | Exceptional 5.0% |
| Turks | 98.5 /100 | #57 | Exceptional 5.0% |
| Lithuanians | 98.5 /100 | #58 | Exceptional 5.0% |
| Immigrants | Netherlands | 98.3 /100 | #59 | Exceptional 5.0% |
| Immigrants | Argentina | 98.1 /100 | #60 | Exceptional 5.0% |
| Cambodians | 98.1 /100 | #61 | Exceptional 5.0% |