Immigrants from Pakistan vs Immigrants from Serbia Unemployment Among Ages 65 to 74 years
COMPARE
Immigrants from Pakistan
Immigrants from Serbia
Unemployment Among Ages 65 to 74 years
Unemployment Among Ages 65 to 74 years Comparison
Immigrants from Pakistan
Immigrants from Serbia
5.4%
UNEMPLOYMENT AMONG AGES 65 TO 74 YEARS
15.2/ 100
METRIC RATING
200th/ 347
METRIC RANK
5.3%
UNEMPLOYMENT AMONG AGES 65 TO 74 YEARS
81.8/ 100
METRIC RATING
135th/ 347
METRIC RANK
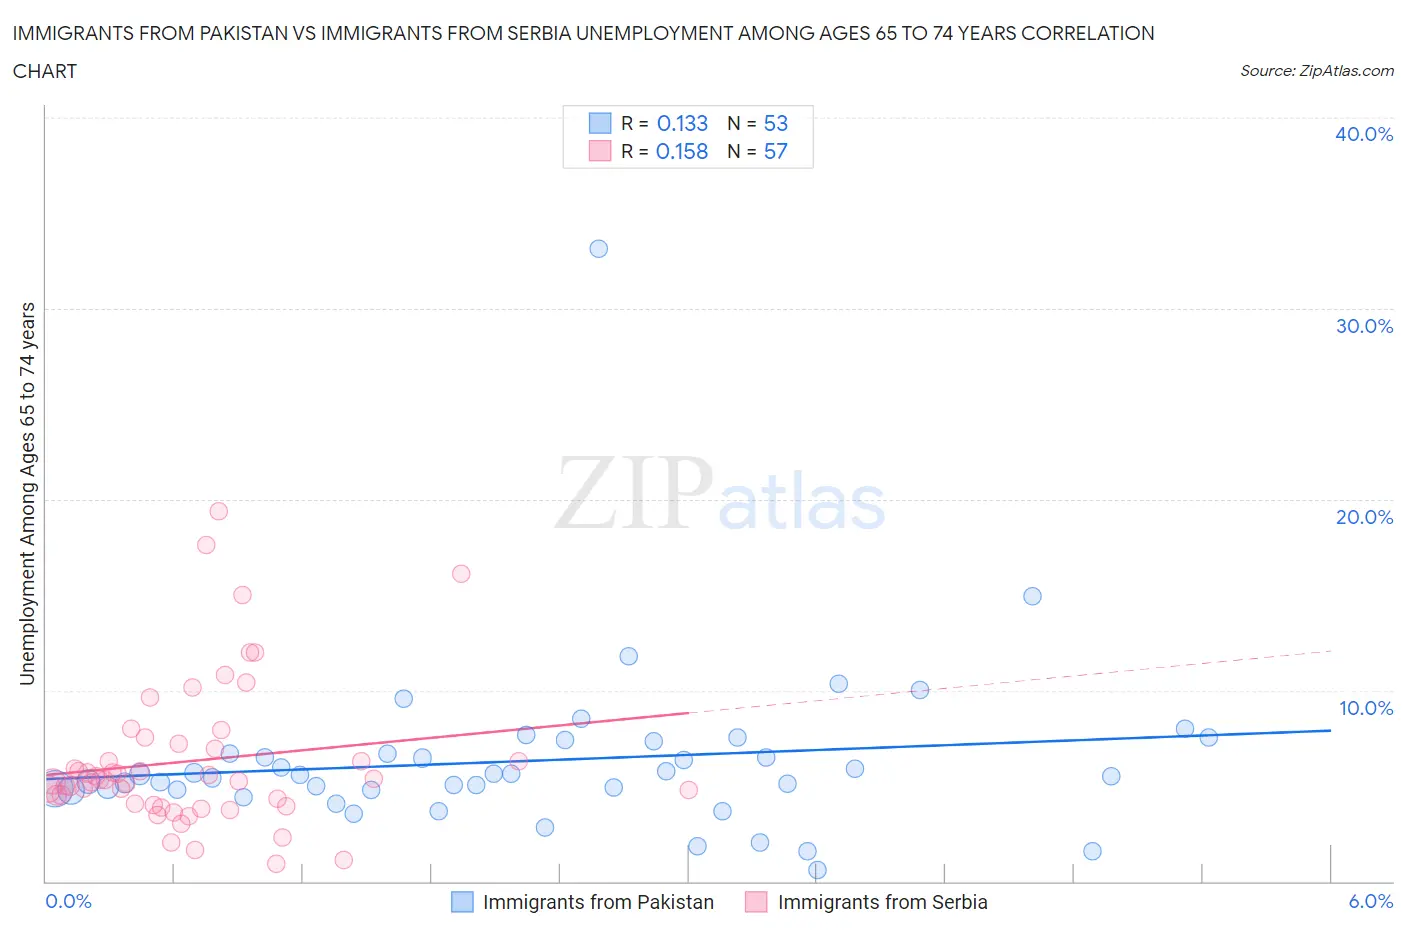
Immigrants from Pakistan vs Immigrants from Serbia Unemployment Among Ages 65 to 74 years Correlation Chart
The statistical analysis conducted on geographies consisting of 261,599,137 people shows a poor positive correlation between the proportion of Immigrants from Pakistan and unemployment rate among population between the ages 65 and 74 in the United States with a correlation coefficient (R) of 0.133 and weighted average of 5.4%. Similarly, the statistical analysis conducted on geographies consisting of 125,871,845 people shows a poor positive correlation between the proportion of Immigrants from Serbia and unemployment rate among population between the ages 65 and 74 in the United States with a correlation coefficient (R) of 0.158 and weighted average of 5.3%, a difference of 2.7%.
Unemployment Among Ages 65 to 74 years Correlation Summary
| Measurement | Immigrants from Pakistan | Immigrants from Serbia |
| Minimum | 0.60% | 0.90% |
| Maximum | 33.1% | 19.4% |
| Range | 32.5% | 18.5% |
| Mean | 6.3% | 6.3% |
| Median | 5.6% | 5.3% |
| Interquartile 25% (IQ1) | 4.8% | 4.1% |
| Interquartile 75% (IQ3) | 7.0% | 7.1% |
| Interquartile Range (IQR) | 2.2% | 3.0% |
| Standard Deviation (Sample) | 4.5% | 3.8% |
| Standard Deviation (Population) | 4.5% | 3.8% |
Similar Demographics by Unemployment Among Ages 65 to 74 years
Demographics Similar to Immigrants from Pakistan by Unemployment Among Ages 65 to 74 years
In terms of unemployment among ages 65 to 74 years, the demographic groups most similar to Immigrants from Pakistan are Immigrants from Western Asia (5.4%, a difference of 0.020%), Immigrants from Belgium (5.4%, a difference of 0.060%), Subsaharan African (5.4%, a difference of 0.060%), Argentinean (5.4%, a difference of 0.060%), and Seminole (5.4%, a difference of 0.060%).
| Demographics | Rating | Rank | Unemployment Among Ages 65 to 74 years |
| Cherokee | 25.8 /100 | #193 | Fair 5.4% |
| Immigrants | Denmark | 24.7 /100 | #194 | Fair 5.4% |
| Immigrants | China | 24.2 /100 | #195 | Fair 5.4% |
| Costa Ricans | 21.1 /100 | #196 | Fair 5.4% |
| Colville | 20.4 /100 | #197 | Fair 5.4% |
| Albanians | 17.8 /100 | #198 | Poor 5.4% |
| Immigrants | Belgium | 16.2 /100 | #199 | Poor 5.4% |
| Immigrants | Pakistan | 15.2 /100 | #200 | Poor 5.4% |
| Immigrants | Western Asia | 14.9 /100 | #201 | Poor 5.4% |
| Sub-Saharan Africans | 14.4 /100 | #202 | Poor 5.4% |
| Argentineans | 14.3 /100 | #203 | Poor 5.4% |
| Seminole | 14.3 /100 | #204 | Poor 5.4% |
| Icelanders | 14.2 /100 | #205 | Poor 5.4% |
| Africans | 12.8 /100 | #206 | Poor 5.5% |
| Immigrants | Uzbekistan | 12.5 /100 | #207 | Poor 5.5% |
Demographics Similar to Immigrants from Serbia by Unemployment Among Ages 65 to 74 years
In terms of unemployment among ages 65 to 74 years, the demographic groups most similar to Immigrants from Serbia are Immigrants from Panama (5.3%, a difference of 0.0%), Ukrainian (5.3%, a difference of 0.010%), Korean (5.3%, a difference of 0.050%), Celtic (5.3%, a difference of 0.050%), and Immigrants from Afghanistan (5.3%, a difference of 0.060%).
| Demographics | Rating | Rank | Unemployment Among Ages 65 to 74 years |
| Immigrants | Hong Kong | 86.5 /100 | #128 | Excellent 5.3% |
| Immigrants | England | 86.2 /100 | #129 | Excellent 5.3% |
| Eastern Europeans | 85.6 /100 | #130 | Excellent 5.3% |
| Immigrants | Russia | 83.0 /100 | #131 | Excellent 5.3% |
| Koreans | 82.6 /100 | #132 | Excellent 5.3% |
| Ukrainians | 82.0 /100 | #133 | Excellent 5.3% |
| Immigrants | Panama | 81.8 /100 | #134 | Excellent 5.3% |
| Immigrants | Serbia | 81.8 /100 | #135 | Excellent 5.3% |
| Celtics | 80.8 /100 | #136 | Excellent 5.3% |
| Immigrants | Afghanistan | 80.8 /100 | #137 | Excellent 5.3% |
| Chileans | 79.7 /100 | #138 | Good 5.3% |
| Finns | 79.0 /100 | #139 | Good 5.3% |
| Immigrants | Laos | 78.6 /100 | #140 | Good 5.3% |
| Immigrants | Asia | 78.4 /100 | #141 | Good 5.3% |
| Turks | 76.2 /100 | #142 | Good 5.3% |