Immigrants from Oceania vs Latvian Unemployment Among Ages 16 to 19 years
COMPARE
Immigrants from Oceania
Latvian
Unemployment Among Ages 16 to 19 years
Unemployment Among Ages 16 to 19 years Comparison
Immigrants from Oceania
Latvians
17.2%
UNEMPLOYMENT AMONG AGES 16 TO 19 YEARS
83.1/ 100
METRIC RATING
136th/ 347
METRIC RANK
16.7%
UNEMPLOYMENT AMONG AGES 16 TO 19 YEARS
98.5/ 100
METRIC RATING
71st/ 347
METRIC RANK
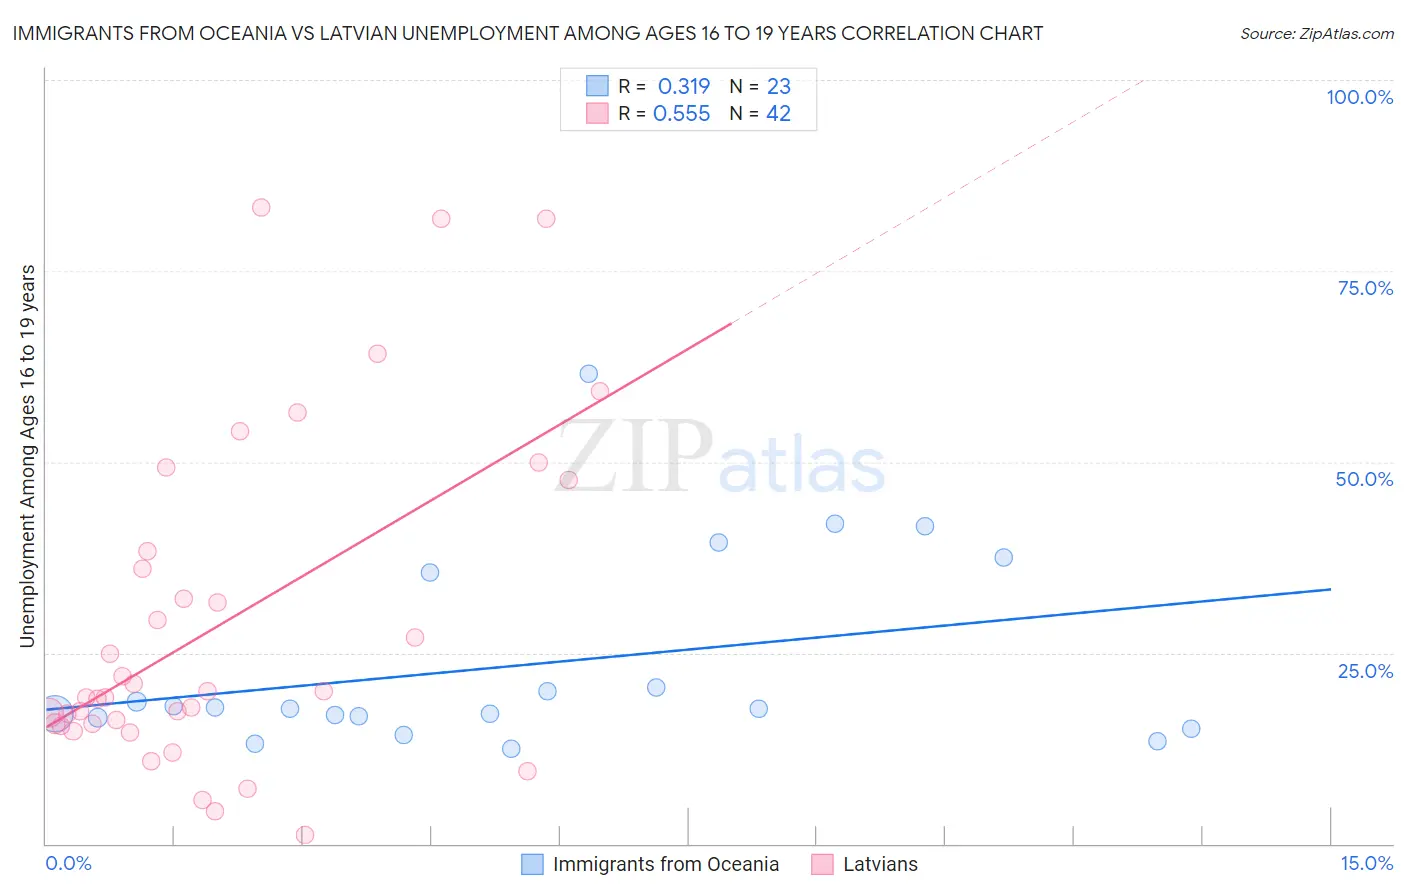
Immigrants from Oceania vs Latvian Unemployment Among Ages 16 to 19 years Correlation Chart
The statistical analysis conducted on geographies consisting of 292,302,650 people shows a mild positive correlation between the proportion of Immigrants from Oceania and unemployment rate among population between the ages 16 and 19 in the United States with a correlation coefficient (R) of 0.319 and weighted average of 17.2%. Similarly, the statistical analysis conducted on geographies consisting of 211,944,479 people shows a substantial positive correlation between the proportion of Latvians and unemployment rate among population between the ages 16 and 19 in the United States with a correlation coefficient (R) of 0.555 and weighted average of 16.7%, a difference of 3.2%.
Unemployment Among Ages 16 to 19 years Correlation Summary
| Measurement | Immigrants from Oceania | Latvian |
| Minimum | 12.4% | 1.1% |
| Maximum | 61.5% | 83.3% |
| Range | 49.1% | 82.2% |
| Mean | 23.5% | 29.0% |
| Median | 17.7% | 19.6% |
| Interquartile 25% (IQ1) | 16.5% | 15.7% |
| Interquartile 75% (IQ3) | 35.5% | 38.4% |
| Interquartile Range (IQR) | 19.0% | 22.7% |
| Standard Deviation (Sample) | 12.8% | 21.6% |
| Standard Deviation (Population) | 12.5% | 21.4% |
Similar Demographics by Unemployment Among Ages 16 to 19 years
Demographics Similar to Immigrants from Oceania by Unemployment Among Ages 16 to 19 years
In terms of unemployment among ages 16 to 19 years, the demographic groups most similar to Immigrants from Oceania are Immigrants from Malaysia (17.2%, a difference of 0.020%), Potawatomi (17.2%, a difference of 0.060%), Samoan (17.2%, a difference of 0.060%), Arab (17.2%, a difference of 0.070%), and Laotian (17.2%, a difference of 0.070%).
| Demographics | Rating | Rank | Unemployment Among Ages 16 to 19 years |
| Creek | 85.5 /100 | #129 | Excellent 17.2% |
| Immigrants | Indonesia | 84.7 /100 | #130 | Excellent 17.2% |
| German Russians | 84.1 /100 | #131 | Excellent 17.2% |
| Arabs | 83.9 /100 | #132 | Excellent 17.2% |
| Laotians | 83.9 /100 | #133 | Excellent 17.2% |
| Potawatomi | 83.8 /100 | #134 | Excellent 17.2% |
| Samoans | 83.7 /100 | #135 | Excellent 17.2% |
| Immigrants | Oceania | 83.1 /100 | #136 | Excellent 17.2% |
| Immigrants | Malaysia | 82.8 /100 | #137 | Excellent 17.2% |
| Bolivians | 81.9 /100 | #138 | Excellent 17.3% |
| Immigrants | Eritrea | 81.1 /100 | #139 | Excellent 17.3% |
| Immigrants | Croatia | 80.8 /100 | #140 | Excellent 17.3% |
| Basques | 80.7 /100 | #141 | Excellent 17.3% |
| Spanish | 79.3 /100 | #142 | Good 17.3% |
| Immigrants | Egypt | 79.1 /100 | #143 | Good 17.3% |
Demographics Similar to Latvians by Unemployment Among Ages 16 to 19 years
In terms of unemployment among ages 16 to 19 years, the demographic groups most similar to Latvians are Immigrants from Canada (16.7%, a difference of 0.040%), Austrian (16.7%, a difference of 0.060%), Serbian (16.7%, a difference of 0.13%), Slavic (16.7%, a difference of 0.20%), and Chickasaw (16.7%, a difference of 0.20%).
| Demographics | Rating | Rank | Unemployment Among Ages 16 to 19 years |
| Northern Europeans | 99.0 /100 | #64 | Exceptional 16.6% |
| Immigrants | Japan | 98.9 /100 | #65 | Exceptional 16.6% |
| Okinawans | 98.9 /100 | #66 | Exceptional 16.6% |
| Slavs | 98.7 /100 | #67 | Exceptional 16.7% |
| Chickasaw | 98.7 /100 | #68 | Exceptional 16.7% |
| Serbians | 98.7 /100 | #69 | Exceptional 16.7% |
| Austrians | 98.6 /100 | #70 | Exceptional 16.7% |
| Latvians | 98.5 /100 | #71 | Exceptional 16.7% |
| Immigrants | Canada | 98.5 /100 | #72 | Exceptional 16.7% |
| Lithuanians | 98.2 /100 | #73 | Exceptional 16.7% |
| Immigrants | Eastern Africa | 98.1 /100 | #74 | Exceptional 16.8% |
| New Zealanders | 98.0 /100 | #75 | Exceptional 16.8% |
| Immigrants | North America | 97.9 /100 | #76 | Exceptional 16.8% |
| Immigrants | Singapore | 97.8 /100 | #77 | Exceptional 16.8% |
| Soviet Union | 97.8 /100 | #78 | Exceptional 16.8% |