Immigrants from Oceania vs Immigrants from Nepal Unemployment Among Ages 45 to 54 years
COMPARE
Immigrants from Oceania
Immigrants from Nepal
Unemployment Among Ages 45 to 54 years
Unemployment Among Ages 45 to 54 years Comparison
Immigrants from Oceania
Immigrants from Nepal
4.4%
UNEMPLOYMENT AMONG AGES 45 TO 54 YEARS
89.5/ 100
METRIC RATING
121st/ 347
METRIC RANK
4.3%
UNEMPLOYMENT AMONG AGES 45 TO 54 YEARS
98.9/ 100
METRIC RATING
67th/ 347
METRIC RANK
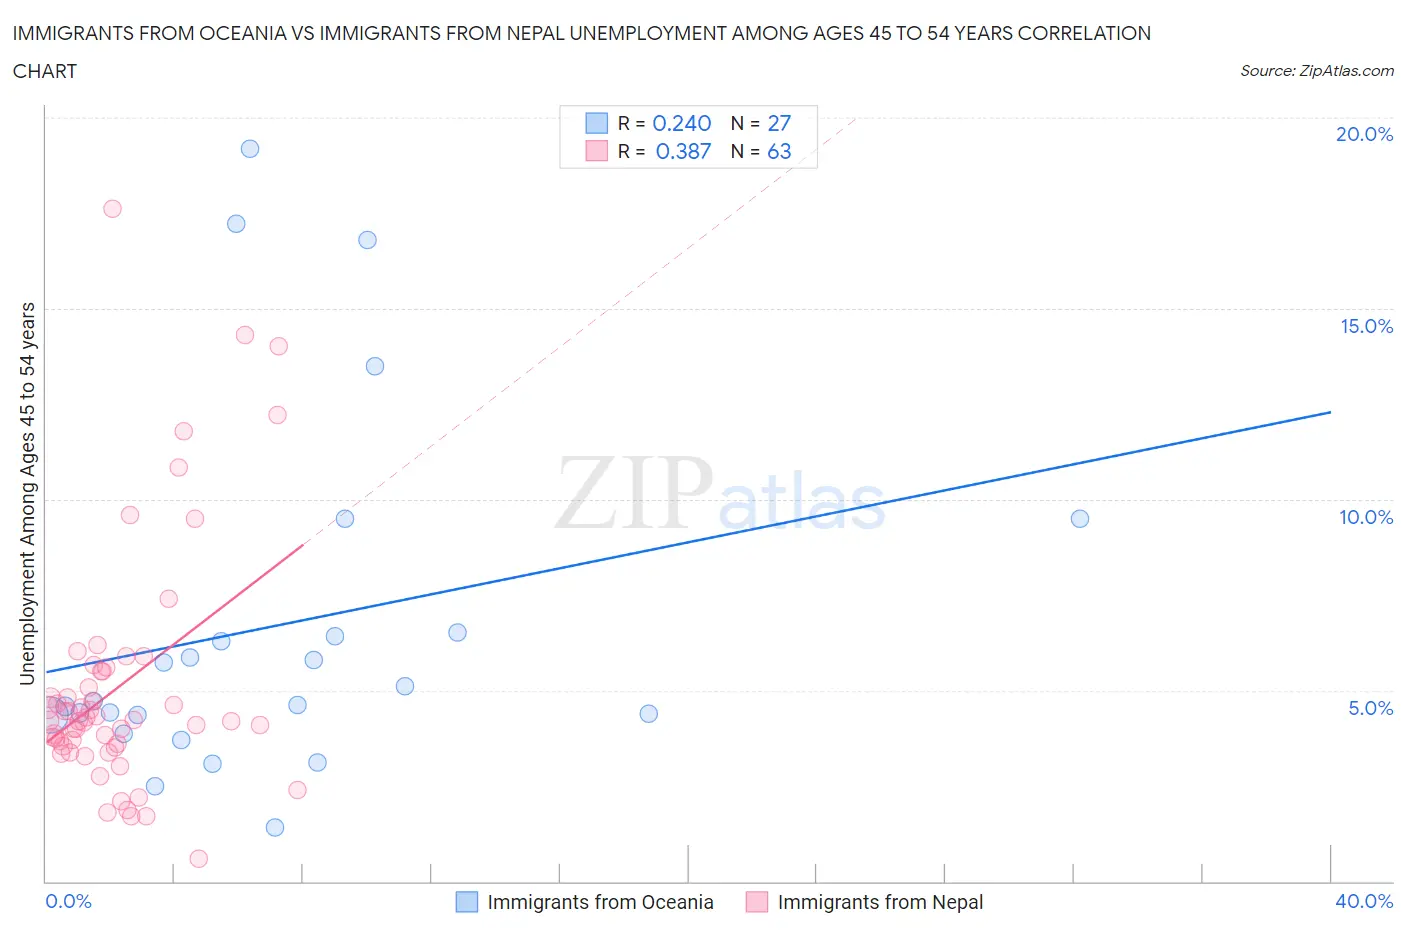
Immigrants from Oceania vs Immigrants from Nepal Unemployment Among Ages 45 to 54 years Correlation Chart
The statistical analysis conducted on geographies consisting of 299,308,619 people shows a weak positive correlation between the proportion of Immigrants from Oceania and unemployment rate among population between the ages 45 and 54 in the United States with a correlation coefficient (R) of 0.240 and weighted average of 4.4%. Similarly, the statistical analysis conducted on geographies consisting of 184,536,194 people shows a mild positive correlation between the proportion of Immigrants from Nepal and unemployment rate among population between the ages 45 and 54 in the United States with a correlation coefficient (R) of 0.387 and weighted average of 4.3%, a difference of 2.9%.
Unemployment Among Ages 45 to 54 years Correlation Summary
| Measurement | Immigrants from Oceania | Immigrants from Nepal |
| Minimum | 1.4% | 0.60% |
| Maximum | 19.2% | 17.6% |
| Range | 17.8% | 17.0% |
| Mean | 6.7% | 5.1% |
| Median | 4.7% | 4.2% |
| Interquartile 25% (IQ1) | 4.3% | 3.5% |
| Interquartile 75% (IQ3) | 6.5% | 5.5% |
| Interquartile Range (IQR) | 2.2% | 2.0% |
| Standard Deviation (Sample) | 4.7% | 3.2% |
| Standard Deviation (Population) | 4.6% | 3.2% |
Similar Demographics by Unemployment Among Ages 45 to 54 years
Demographics Similar to Immigrants from Oceania by Unemployment Among Ages 45 to 54 years
In terms of unemployment among ages 45 to 54 years, the demographic groups most similar to Immigrants from Oceania are American (4.4%, a difference of 0.010%), Immigrants from Kazakhstan (4.4%, a difference of 0.010%), Native Hawaiian (4.4%, a difference of 0.050%), Immigrants from Romania (4.4%, a difference of 0.070%), and Immigrants from Asia (4.4%, a difference of 0.090%).
| Demographics | Rating | Rank | Unemployment Among Ages 45 to 54 years |
| Immigrants | Chile | 90.9 /100 | #114 | Exceptional 4.4% |
| Pakistanis | 90.7 /100 | #115 | Exceptional 4.4% |
| Immigrants | North Macedonia | 90.6 /100 | #116 | Exceptional 4.4% |
| South Africans | 90.4 /100 | #117 | Exceptional 4.4% |
| Immigrants | Romania | 90.0 /100 | #118 | Exceptional 4.4% |
| Native Hawaiians | 90.0 /100 | #119 | Excellent 4.4% |
| Americans | 89.6 /100 | #120 | Excellent 4.4% |
| Immigrants | Oceania | 89.5 /100 | #121 | Excellent 4.4% |
| Immigrants | Kazakhstan | 89.5 /100 | #122 | Excellent 4.4% |
| Immigrants | Asia | 88.8 /100 | #123 | Excellent 4.4% |
| Spanish | 88.8 /100 | #124 | Excellent 4.4% |
| Immigrants | Vietnam | 88.6 /100 | #125 | Excellent 4.4% |
| Immigrants | Czechoslovakia | 87.8 /100 | #126 | Excellent 4.4% |
| Nicaraguans | 87.6 /100 | #127 | Excellent 4.4% |
| Immigrants | Northern Europe | 86.9 /100 | #128 | Excellent 4.4% |
Demographics Similar to Immigrants from Nepal by Unemployment Among Ages 45 to 54 years
In terms of unemployment among ages 45 to 54 years, the demographic groups most similar to Immigrants from Nepal are Turkish (4.3%, a difference of 0.020%), Immigrants from Sudan (4.3%, a difference of 0.060%), Slovak (4.3%, a difference of 0.070%), Austrian (4.3%, a difference of 0.090%), and Pennsylvania German (4.3%, a difference of 0.19%).
| Demographics | Rating | Rank | Unemployment Among Ages 45 to 54 years |
| Immigrants | Korea | 99.2 /100 | #60 | Exceptional 4.3% |
| Immigrants | Pakistan | 99.2 /100 | #61 | Exceptional 4.3% |
| Lithuanians | 99.1 /100 | #62 | Exceptional 4.3% |
| Pennsylvania Germans | 99.1 /100 | #63 | Exceptional 4.3% |
| Austrians | 99.0 /100 | #64 | Exceptional 4.3% |
| Immigrants | Sudan | 99.0 /100 | #65 | Exceptional 4.3% |
| Turks | 98.9 /100 | #66 | Exceptional 4.3% |
| Immigrants | Nepal | 98.9 /100 | #67 | Exceptional 4.3% |
| Slovaks | 98.8 /100 | #68 | Exceptional 4.3% |
| Immigrants | Japan | 98.7 /100 | #69 | Exceptional 4.3% |
| Paraguayans | 98.6 /100 | #70 | Exceptional 4.3% |
| Palestinians | 98.5 /100 | #71 | Exceptional 4.3% |
| Whites/Caucasians | 98.4 /100 | #72 | Exceptional 4.3% |
| Canadians | 98.2 /100 | #73 | Exceptional 4.3% |
| Immigrants | Belgium | 98.2 /100 | #74 | Exceptional 4.3% |