Immigrants from Oceania vs Immigrants from Malaysia Unemployment Among Ages 25 to 29 years
COMPARE
Immigrants from Oceania
Immigrants from Malaysia
Unemployment Among Ages 25 to 29 years
Unemployment Among Ages 25 to 29 years Comparison
Immigrants from Oceania
Immigrants from Malaysia
6.4%
UNEMPLOYMENT AMONG AGES 25 TO 29 YEARS
94.1/ 100
METRIC RATING
89th/ 347
METRIC RANK
6.3%
UNEMPLOYMENT AMONG AGES 25 TO 29 YEARS
97.5/ 100
METRIC RATING
70th/ 347
METRIC RANK
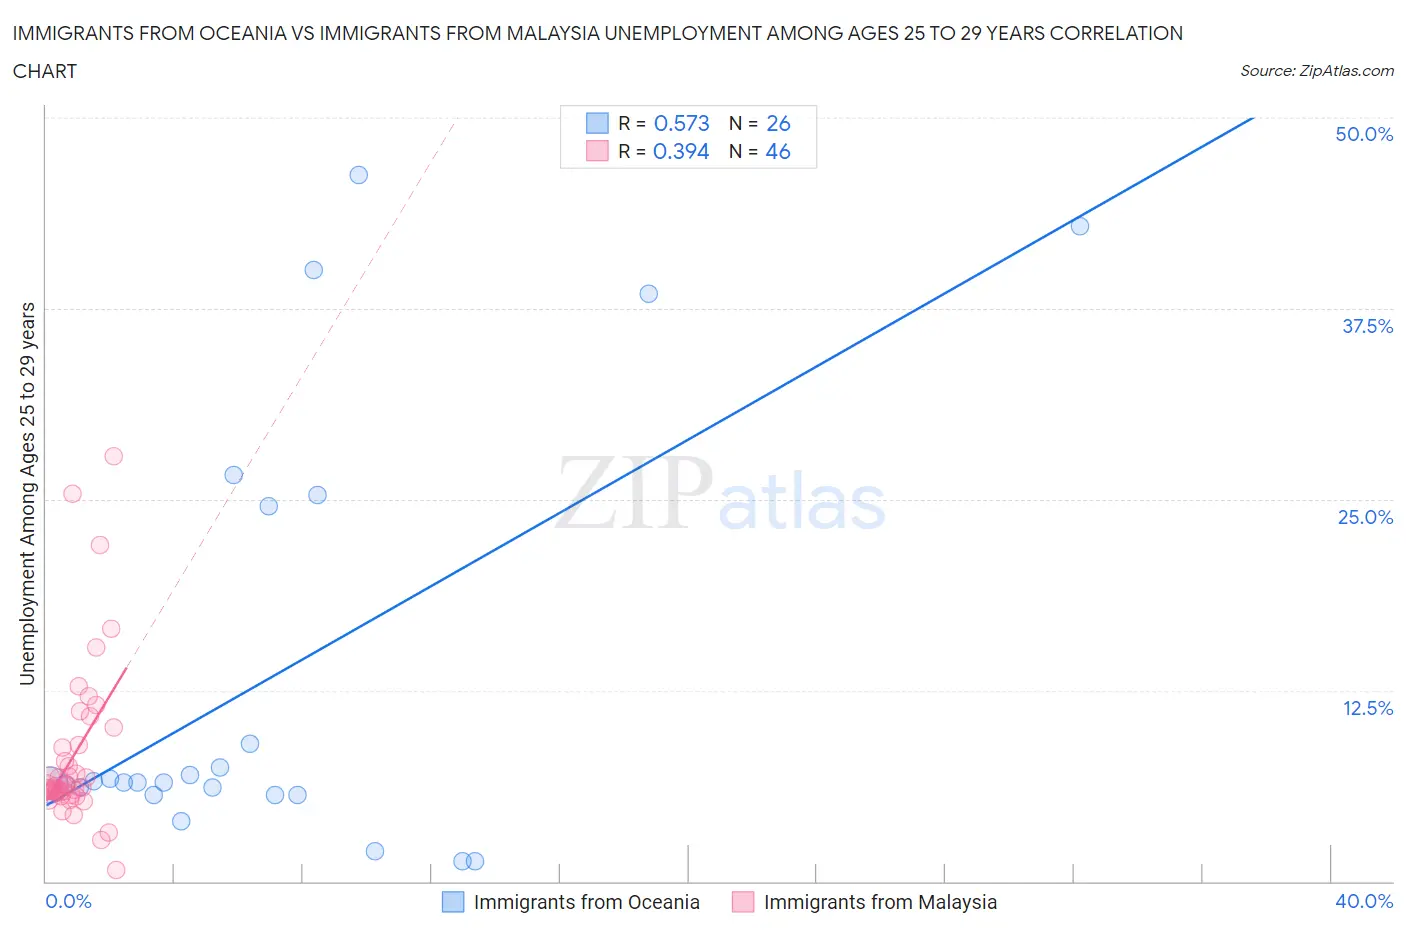
Immigrants from Oceania vs Immigrants from Malaysia Unemployment Among Ages 25 to 29 years Correlation Chart
The statistical analysis conducted on geographies consisting of 293,361,593 people shows a substantial positive correlation between the proportion of Immigrants from Oceania and unemployment rate among population between the ages 25 and 29 in the United States with a correlation coefficient (R) of 0.573 and weighted average of 6.4%. Similarly, the statistical analysis conducted on geographies consisting of 193,796,374 people shows a mild positive correlation between the proportion of Immigrants from Malaysia and unemployment rate among population between the ages 25 and 29 in the United States with a correlation coefficient (R) of 0.394 and weighted average of 6.3%, a difference of 1.4%.
Unemployment Among Ages 25 to 29 years Correlation Summary
| Measurement | Immigrants from Oceania | Immigrants from Malaysia |
| Minimum | 1.3% | 0.70% |
| Maximum | 46.2% | 27.8% |
| Range | 44.9% | 27.1% |
| Mean | 13.5% | 8.3% |
| Median | 6.5% | 6.2% |
| Interquartile 25% (IQ1) | 5.7% | 5.8% |
| Interquartile 75% (IQ3) | 24.6% | 8.9% |
| Interquartile Range (IQR) | 18.9% | 3.1% |
| Standard Deviation (Sample) | 14.1% | 5.4% |
| Standard Deviation (Population) | 13.8% | 5.4% |
Demographics Similar to Immigrants from Oceania and Immigrants from Malaysia by Unemployment Among Ages 25 to 29 years
In terms of unemployment among ages 25 to 29 years, the demographic groups most similar to Immigrants from Oceania are Immigrants from Indonesia (6.4%, a difference of 0.11%), Marshallese (6.4%, a difference of 0.17%), Immigrants from Asia (6.3%, a difference of 0.23%), Immigrants from Sweden (6.3%, a difference of 0.32%), and Immigrants from Spain (6.3%, a difference of 0.35%). Similarly, the demographic groups most similar to Immigrants from Malaysia are Immigrants from Hong Kong (6.3%, a difference of 0.020%), Immigrants from France (6.3%, a difference of 0.040%), Scandinavian (6.3%, a difference of 0.060%), Belgian (6.3%, a difference of 0.31%), and Carpatho Rusyn (6.3%, a difference of 0.33%).
| Demographics | Rating | Rank | Unemployment Among Ages 25 to 29 years |
| Immigrants | Hong Kong | 97.5 /100 | #69 | Exceptional 6.3% |
| Immigrants | Malaysia | 97.5 /100 | #70 | Exceptional 6.3% |
| Immigrants | France | 97.4 /100 | #71 | Exceptional 6.3% |
| Scandinavians | 97.4 /100 | #72 | Exceptional 6.3% |
| Belgians | 97.0 /100 | #73 | Exceptional 6.3% |
| Carpatho Rusyns | 96.9 /100 | #74 | Exceptional 6.3% |
| Immigrants | Jordan | 96.8 /100 | #75 | Exceptional 6.3% |
| Immigrants | Korea | 96.7 /100 | #76 | Exceptional 6.3% |
| Icelanders | 96.6 /100 | #77 | Exceptional 6.3% |
| Asians | 96.4 /100 | #78 | Exceptional 6.3% |
| Immigrants | Switzerland | 96.0 /100 | #79 | Exceptional 6.3% |
| Immigrants | Romania | 95.9 /100 | #80 | Exceptional 6.3% |
| Iranians | 95.8 /100 | #81 | Exceptional 6.3% |
| Immigrants | Poland | 95.7 /100 | #82 | Exceptional 6.3% |
| Slovenes | 95.3 /100 | #83 | Exceptional 6.3% |
| Immigrants | Spain | 95.2 /100 | #84 | Exceptional 6.3% |
| Immigrants | Sweden | 95.1 /100 | #85 | Exceptional 6.3% |
| Immigrants | Asia | 94.9 /100 | #86 | Exceptional 6.3% |
| Marshallese | 94.7 /100 | #87 | Exceptional 6.4% |
| Immigrants | Indonesia | 94.5 /100 | #88 | Exceptional 6.4% |
| Immigrants | Oceania | 94.1 /100 | #89 | Exceptional 6.4% |