Immigrants from Norway vs Tohono O'odham Unemployment Among Ages 25 to 29 years
COMPARE
Immigrants from Norway
Tohono O'odham
Unemployment Among Ages 25 to 29 years
Unemployment Among Ages 25 to 29 years Comparison
Immigrants from Norway
Tohono O'odham
6.8%
UNEMPLOYMENT AMONG AGES 25 TO 29 YEARS
21.2/ 100
METRIC RATING
203rd/ 347
METRIC RANK
12.1%
UNEMPLOYMENT AMONG AGES 25 TO 29 YEARS
0.0/ 100
METRIC RATING
341st/ 347
METRIC RANK
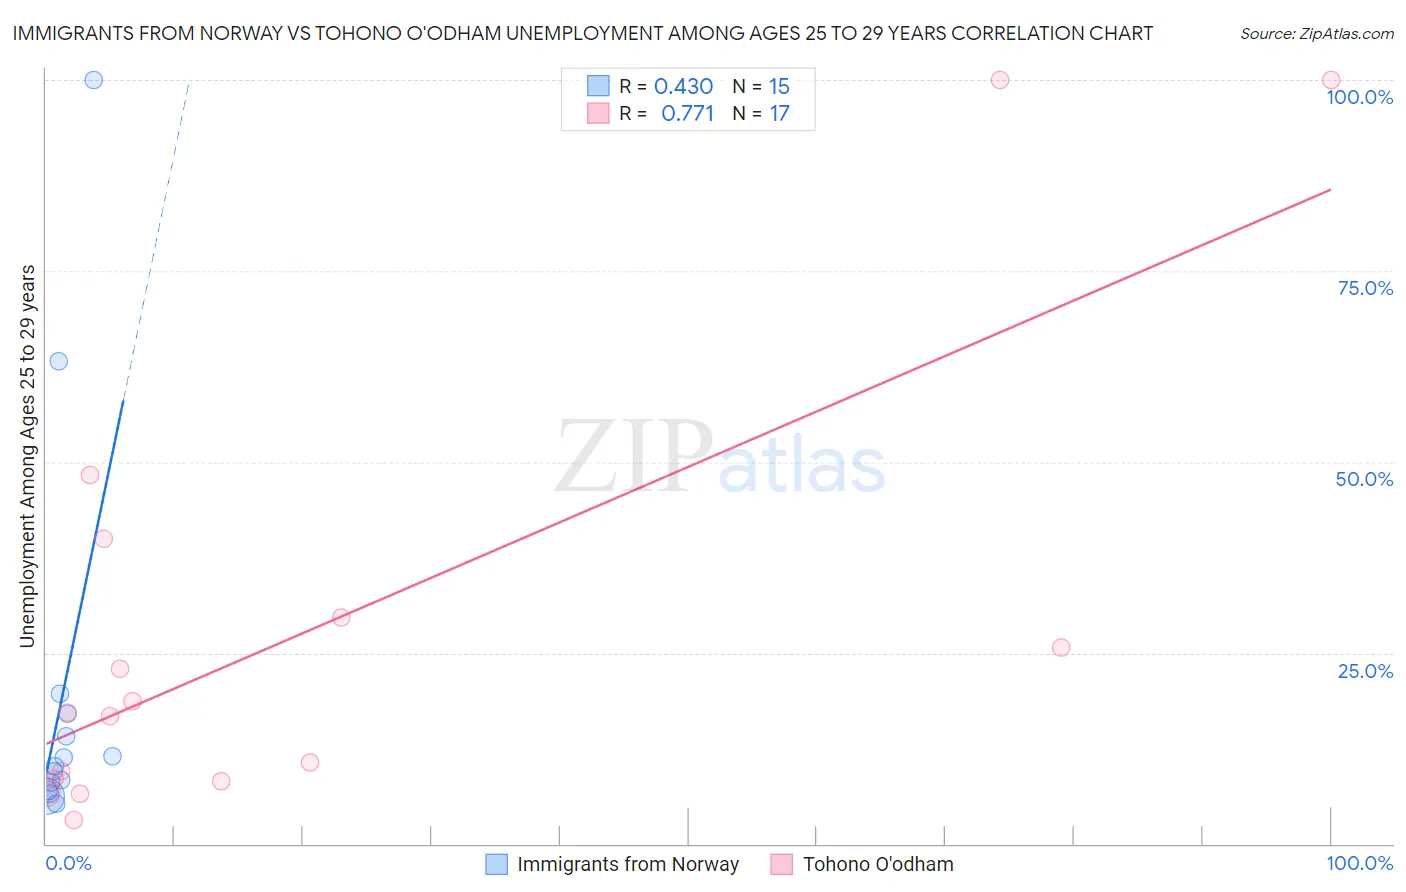
Immigrants from Norway vs Tohono O'odham Unemployment Among Ages 25 to 29 years Correlation Chart
The statistical analysis conducted on geographies consisting of 113,962,489 people shows a moderate positive correlation between the proportion of Immigrants from Norway and unemployment rate among population between the ages 25 and 29 in the United States with a correlation coefficient (R) of 0.430 and weighted average of 6.8%. Similarly, the statistical analysis conducted on geographies consisting of 58,234,403 people shows a strong positive correlation between the proportion of Tohono O'odham and unemployment rate among population between the ages 25 and 29 in the United States with a correlation coefficient (R) of 0.771 and weighted average of 12.1%, a difference of 78.0%.
Unemployment Among Ages 25 to 29 years Correlation Summary
| Measurement | Immigrants from Norway | Tohono O'odham |
| Minimum | 5.2% | 3.0% |
| Maximum | 100.0% | 100.0% |
| Range | 94.8% | 97.0% |
| Mean | 19.8% | 27.8% |
| Median | 10.2% | 17.1% |
| Interquartile 25% (IQ1) | 7.0% | 8.3% |
| Interquartile 75% (IQ3) | 17.1% | 34.9% |
| Interquartile Range (IQR) | 10.1% | 26.5% |
| Standard Deviation (Sample) | 26.3% | 29.8% |
| Standard Deviation (Population) | 25.4% | 28.9% |
Similar Demographics by Unemployment Among Ages 25 to 29 years
Demographics Similar to Immigrants from Norway by Unemployment Among Ages 25 to 29 years
In terms of unemployment among ages 25 to 29 years, the demographic groups most similar to Immigrants from Norway are Immigrants from Argentina (6.8%, a difference of 0.030%), Basque (6.8%, a difference of 0.11%), Scotch-Irish (6.8%, a difference of 0.12%), Immigrants from England (6.8%, a difference of 0.13%), and Ugandan (6.8%, a difference of 0.14%).
| Demographics | Rating | Rank | Unemployment Among Ages 25 to 29 years |
| Hungarians | 26.8 /100 | #196 | Fair 6.8% |
| Italians | 26.5 /100 | #197 | Fair 6.8% |
| Immigrants | Southern Europe | 24.6 /100 | #198 | Fair 6.8% |
| Guamanians/Chamorros | 24.3 /100 | #199 | Fair 6.8% |
| South American Indians | 23.3 /100 | #200 | Fair 6.8% |
| Basques | 22.5 /100 | #201 | Fair 6.8% |
| Immigrants | Argentina | 21.6 /100 | #202 | Fair 6.8% |
| Immigrants | Norway | 21.2 /100 | #203 | Fair 6.8% |
| Scotch-Irish | 20.0 /100 | #204 | Poor 6.8% |
| Immigrants | England | 19.8 /100 | #205 | Poor 6.8% |
| Ugandans | 19.8 /100 | #206 | Poor 6.8% |
| Immigrants | Denmark | 19.0 /100 | #207 | Poor 6.8% |
| Immigrants | Germany | 18.8 /100 | #208 | Poor 6.8% |
| Hawaiians | 17.1 /100 | #209 | Poor 6.8% |
| Canadians | 16.9 /100 | #210 | Poor 6.8% |
Demographics Similar to Tohono O'odham by Unemployment Among Ages 25 to 29 years
In terms of unemployment among ages 25 to 29 years, the demographic groups most similar to Tohono O'odham are Navajo (12.2%, a difference of 0.80%), Cheyenne (11.8%, a difference of 2.1%), Pima (11.8%, a difference of 2.5%), Sioux (11.7%, a difference of 3.5%), and Menominee (11.3%, a difference of 7.1%).
| Demographics | Rating | Rank | Unemployment Among Ages 25 to 29 years |
| Alaskan Athabascans | 0.0 /100 | #333 | Tragic 10.8% |
| Yuman | 0.0 /100 | #334 | Tragic 11.0% |
| Puerto Ricans | 0.0 /100 | #335 | Tragic 11.1% |
| Lumbee | 0.0 /100 | #336 | Tragic 11.2% |
| Menominee | 0.0 /100 | #337 | Tragic 11.3% |
| Sioux | 0.0 /100 | #338 | Tragic 11.7% |
| Pima | 0.0 /100 | #339 | Tragic 11.8% |
| Cheyenne | 0.0 /100 | #340 | Tragic 11.8% |
| Tohono O'odham | 0.0 /100 | #341 | Tragic 12.1% |
| Navajo | 0.0 /100 | #342 | Tragic 12.2% |
| Inupiat | 0.0 /100 | #343 | Tragic 13.4% |
| Hopi | 0.0 /100 | #344 | Tragic 13.5% |
| Arapaho | 0.0 /100 | #345 | Tragic 15.4% |
| Crow | 0.0 /100 | #346 | Tragic 15.4% |
| Yup'ik | 0.0 /100 | #347 | Tragic 17.9% |