Immigrants from Norway vs Swiss Male Unemployment
COMPARE
Immigrants from Norway
Swiss
Male Unemployment
Male Unemployment Comparison
Immigrants from Norway
Swiss
5.2%
MALE UNEMPLOYMENT
71.0/ 100
METRIC RATING
160th/ 347
METRIC RANK
4.7%
MALE UNEMPLOYMENT
99.9/ 100
METRIC RATING
16th/ 347
METRIC RANK
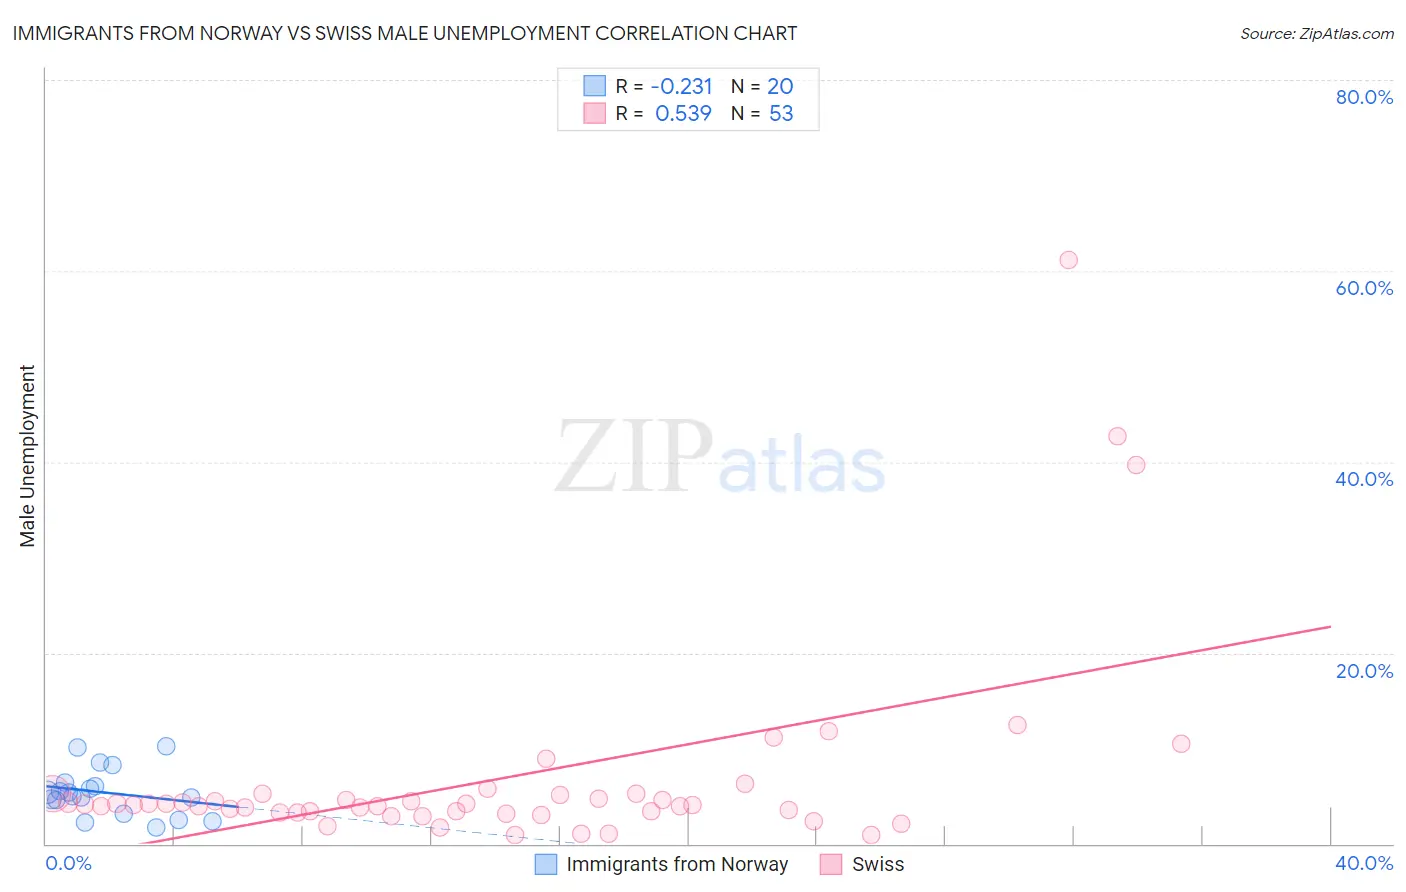
Immigrants from Norway vs Swiss Male Unemployment Correlation Chart
The statistical analysis conducted on geographies consisting of 116,545,854 people shows a weak negative correlation between the proportion of Immigrants from Norway and unemployment rate among males in the United States with a correlation coefficient (R) of -0.231 and weighted average of 5.2%. Similarly, the statistical analysis conducted on geographies consisting of 460,477,657 people shows a substantial positive correlation between the proportion of Swiss and unemployment rate among males in the United States with a correlation coefficient (R) of 0.539 and weighted average of 4.7%, a difference of 11.0%.
Male Unemployment Correlation Summary
| Measurement | Immigrants from Norway | Swiss |
| Minimum | 1.7% | 0.90% |
| Maximum | 10.2% | 61.1% |
| Range | 8.5% | 60.2% |
| Mean | 5.4% | 6.9% |
| Median | 5.2% | 4.1% |
| Interquartile 25% (IQ1) | 3.8% | 3.3% |
| Interquartile 75% (IQ3) | 6.2% | 5.2% |
| Interquartile Range (IQR) | 2.4% | 1.8% |
| Standard Deviation (Sample) | 2.4% | 10.7% |
| Standard Deviation (Population) | 2.4% | 10.6% |
Similar Demographics by Male Unemployment
Demographics Similar to Immigrants from Norway by Male Unemployment
In terms of male unemployment, the demographic groups most similar to Immigrants from Norway are Indonesian (5.2%, a difference of 0.010%), Immigrants from China (5.2%, a difference of 0.030%), Immigrants from Indonesia (5.2%, a difference of 0.040%), Immigrants from Northern Africa (5.2%, a difference of 0.090%), and American (5.2%, a difference of 0.12%).
| Demographics | Rating | Rank | Male Unemployment |
| Immigrants | Uruguay | 73.9 /100 | #153 | Good 5.2% |
| Laotians | 73.8 /100 | #154 | Good 5.2% |
| Immigrants | Hungary | 73.4 /100 | #155 | Good 5.2% |
| Americans | 72.7 /100 | #156 | Good 5.2% |
| Immigrants | Northern Africa | 72.3 /100 | #157 | Good 5.2% |
| Immigrants | Indonesia | 71.5 /100 | #158 | Good 5.2% |
| Indonesians | 71.2 /100 | #159 | Good 5.2% |
| Immigrants | Norway | 71.0 /100 | #160 | Good 5.2% |
| Immigrants | China | 70.6 /100 | #161 | Good 5.2% |
| Immigrants | Egypt | 65.9 /100 | #162 | Good 5.2% |
| Immigrants | Hong Kong | 65.7 /100 | #163 | Good 5.2% |
| Afghans | 62.0 /100 | #164 | Good 5.3% |
| South Americans | 60.6 /100 | #165 | Good 5.3% |
| Immigrants | Morocco | 60.2 /100 | #166 | Good 5.3% |
| Immigrants | Vietnam | 58.1 /100 | #167 | Average 5.3% |
Demographics Similar to Swiss by Male Unemployment
In terms of male unemployment, the demographic groups most similar to Swiss are Scandinavian (4.7%, a difference of 0.050%), German (4.7%, a difference of 0.32%), Bolivian (4.7%, a difference of 0.34%), Filipino (4.7%, a difference of 0.73%), and Immigrants from Bolivia (4.7%, a difference of 1.0%).
| Demographics | Rating | Rank | Male Unemployment |
| Thais | 100.0 /100 | #9 | Exceptional 4.6% |
| Cubans | 100.0 /100 | #10 | Exceptional 4.6% |
| Swedes | 100.0 /100 | #11 | Exceptional 4.6% |
| Immigrants | Bolivia | 100.0 /100 | #12 | Exceptional 4.7% |
| Bolivians | 100.0 /100 | #13 | Exceptional 4.7% |
| Germans | 100.0 /100 | #14 | Exceptional 4.7% |
| Scandinavians | 100.0 /100 | #15 | Exceptional 4.7% |
| Swiss | 99.9 /100 | #16 | Exceptional 4.7% |
| Filipinos | 99.9 /100 | #17 | Exceptional 4.7% |
| English | 99.9 /100 | #18 | Exceptional 4.8% |
| Europeans | 99.9 /100 | #19 | Exceptional 4.8% |
| Pennsylvania Germans | 99.9 /100 | #20 | Exceptional 4.8% |
| Immigrants | Taiwan | 99.9 /100 | #21 | Exceptional 4.8% |
| Carpatho Rusyns | 99.9 /100 | #22 | Exceptional 4.8% |
| Tongans | 99.9 /100 | #23 | Exceptional 4.8% |