Immigrants from Norway vs Indonesian Unemployment Among Ages 65 to 74 years
COMPARE
Immigrants from Norway
Indonesian
Unemployment Among Ages 65 to 74 years
Unemployment Among Ages 65 to 74 years Comparison
Immigrants from Norway
Indonesians
5.7%
UNEMPLOYMENT AMONG AGES 65 TO 74 YEARS
0.1/ 100
METRIC RATING
279th/ 347
METRIC RANK
4.7%
UNEMPLOYMENT AMONG AGES 65 TO 74 YEARS
100.0/ 100
METRIC RATING
7th/ 347
METRIC RANK
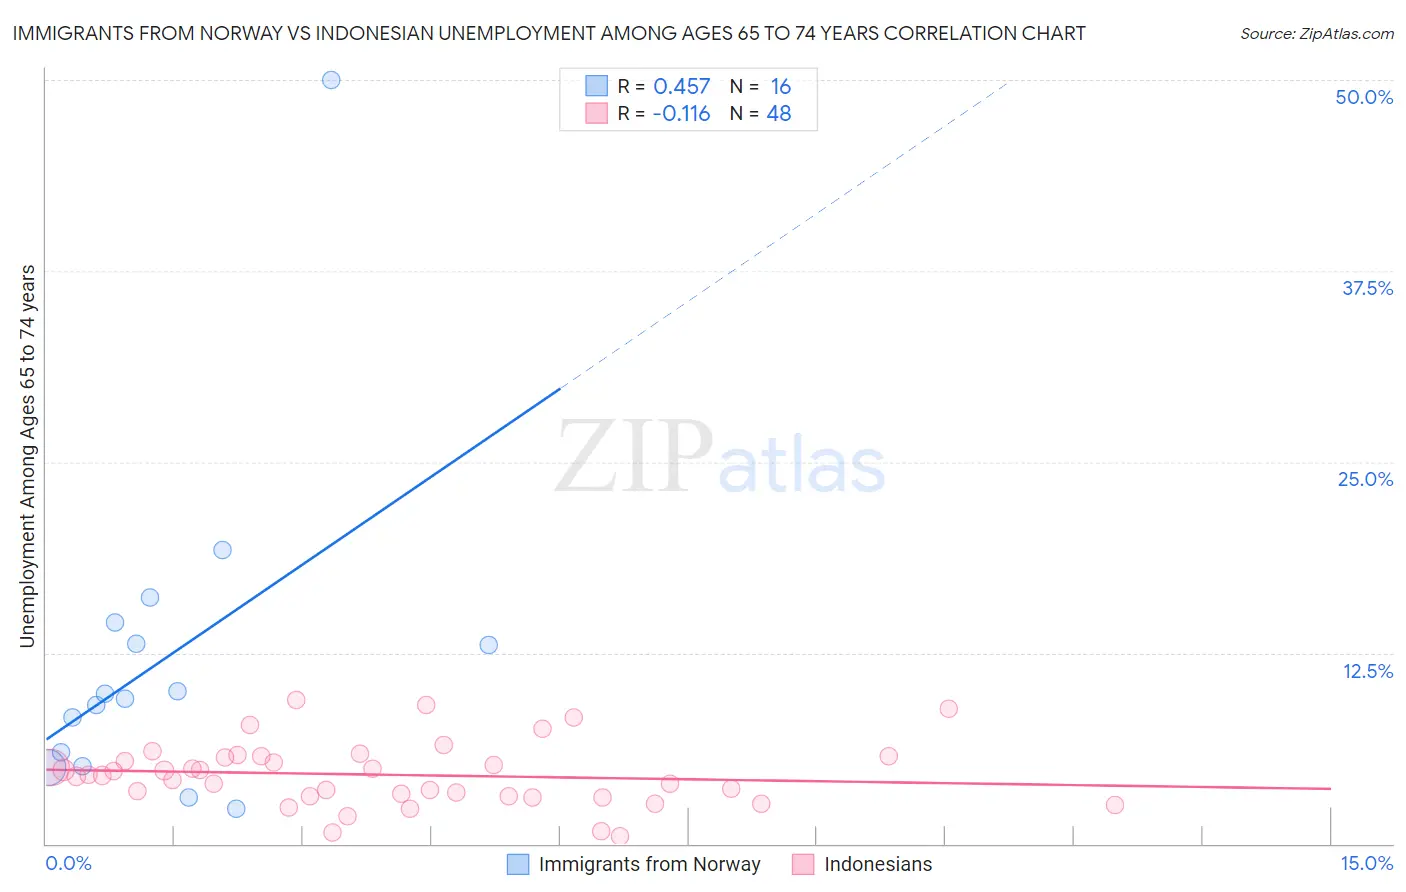
Immigrants from Norway vs Indonesian Unemployment Among Ages 65 to 74 years Correlation Chart
The statistical analysis conducted on geographies consisting of 111,271,306 people shows a moderate positive correlation between the proportion of Immigrants from Norway and unemployment rate among population between the ages 65 and 74 in the United States with a correlation coefficient (R) of 0.457 and weighted average of 5.7%. Similarly, the statistical analysis conducted on geographies consisting of 153,340,120 people shows a poor negative correlation between the proportion of Indonesians and unemployment rate among population between the ages 65 and 74 in the United States with a correlation coefficient (R) of -0.116 and weighted average of 4.7%, a difference of 21.2%.
Unemployment Among Ages 65 to 74 years Correlation Summary
| Measurement | Immigrants from Norway | Indonesian |
| Minimum | 2.3% | 0.50% |
| Maximum | 50.0% | 9.4% |
| Range | 47.7% | 8.9% |
| Mean | 12.1% | 4.5% |
| Median | 9.6% | 4.5% |
| Interquartile 25% (IQ1) | 5.5% | 3.1% |
| Interquartile 75% (IQ3) | 13.8% | 5.7% |
| Interquartile Range (IQR) | 8.3% | 2.6% |
| Standard Deviation (Sample) | 11.2% | 2.1% |
| Standard Deviation (Population) | 10.8% | 2.1% |
Similar Demographics by Unemployment Among Ages 65 to 74 years
Demographics Similar to Immigrants from Norway by Unemployment Among Ages 65 to 74 years
In terms of unemployment among ages 65 to 74 years, the demographic groups most similar to Immigrants from Norway are Moroccan (5.7%, a difference of 0.0%), Immigrants from West Indies (5.7%, a difference of 0.080%), Ottawa (5.7%, a difference of 0.13%), Mexican American Indian (5.7%, a difference of 0.16%), and Cypriot (5.7%, a difference of 0.16%).
| Demographics | Rating | Rank | Unemployment Among Ages 65 to 74 years |
| Yaqui | 0.1 /100 | #272 | Tragic 5.7% |
| Bahamians | 0.1 /100 | #273 | Tragic 5.7% |
| Immigrants | Guyana | 0.1 /100 | #274 | Tragic 5.7% |
| Immigrants | Liberia | 0.1 /100 | #275 | Tragic 5.7% |
| Somalis | 0.1 /100 | #276 | Tragic 5.7% |
| Immigrants | South America | 0.1 /100 | #277 | Tragic 5.7% |
| Mexican American Indians | 0.1 /100 | #278 | Tragic 5.7% |
| Immigrants | Norway | 0.1 /100 | #279 | Tragic 5.7% |
| Moroccans | 0.1 /100 | #280 | Tragic 5.7% |
| Immigrants | West Indies | 0.1 /100 | #281 | Tragic 5.7% |
| Ottawa | 0.1 /100 | #282 | Tragic 5.7% |
| Cypriots | 0.1 /100 | #283 | Tragic 5.7% |
| Chippewa | 0.1 /100 | #284 | Tragic 5.7% |
| Immigrants | Sierra Leone | 0.1 /100 | #285 | Tragic 5.7% |
| Marshallese | 0.1 /100 | #286 | Tragic 5.7% |
Demographics Similar to Indonesians by Unemployment Among Ages 65 to 74 years
In terms of unemployment among ages 65 to 74 years, the demographic groups most similar to Indonesians are Comanche (4.7%, a difference of 0.17%), Chickasaw (4.7%, a difference of 0.43%), Osage (4.7%, a difference of 0.55%), Immigrants from Congo (4.7%, a difference of 0.96%), and Tongan (4.7%, a difference of 1.1%).
| Demographics | Rating | Rank | Unemployment Among Ages 65 to 74 years |
| Hmong | 100.0 /100 | #1 | Exceptional 4.2% |
| Chinese | 100.0 /100 | #2 | Exceptional 4.4% |
| Fijians | 100.0 /100 | #3 | Exceptional 4.5% |
| Tsimshian | 100.0 /100 | #4 | Exceptional 4.6% |
| Sudanese | 100.0 /100 | #5 | Exceptional 4.6% |
| Immigrants | Cuba | 100.0 /100 | #6 | Exceptional 4.6% |
| Indonesians | 100.0 /100 | #7 | Exceptional 4.7% |
| Comanche | 100.0 /100 | #8 | Exceptional 4.7% |
| Chickasaw | 100.0 /100 | #9 | Exceptional 4.7% |
| Osage | 100.0 /100 | #10 | Exceptional 4.7% |
| Immigrants | Congo | 100.0 /100 | #11 | Exceptional 4.7% |
| Tongans | 100.0 /100 | #12 | Exceptional 4.7% |
| Lumbee | 100.0 /100 | #13 | Exceptional 4.8% |
| Cubans | 100.0 /100 | #14 | Exceptional 4.8% |
| Immigrants | North Macedonia | 100.0 /100 | #15 | Exceptional 4.8% |