Immigrants from Norway vs Chippewa Unemployment Among Youth under 25 years
COMPARE
Immigrants from Norway
Chippewa
Unemployment Among Youth under 25 years
Unemployment Among Youth under 25 years Comparison
Immigrants from Norway
Chippewa
11.3%
UNEMPLOYMENT AMONG YOUTH UNDER 25 YEARS
91.5/ 100
METRIC RATING
110th/ 347
METRIC RANK
13.5%
UNEMPLOYMENT AMONG YOUTH UNDER 25 YEARS
0.0/ 100
METRIC RATING
295th/ 347
METRIC RANK
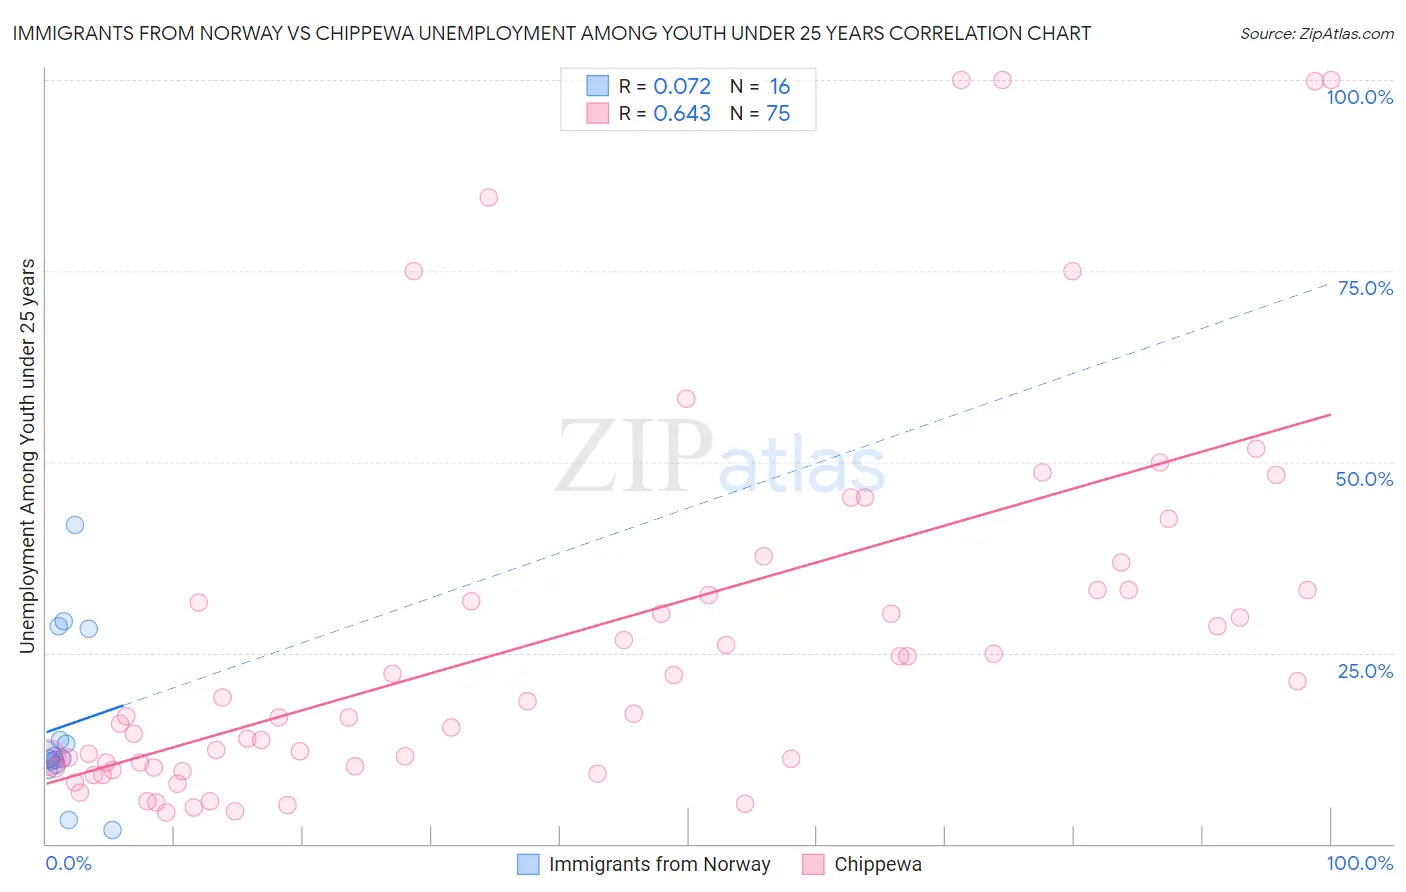
Immigrants from Norway vs Chippewa Unemployment Among Youth under 25 years Correlation Chart
The statistical analysis conducted on geographies consisting of 116,250,707 people shows a slight positive correlation between the proportion of Immigrants from Norway and unemployment rate among youth under the age of 25 in the United States with a correlation coefficient (R) of 0.072 and weighted average of 11.3%. Similarly, the statistical analysis conducted on geographies consisting of 212,651,638 people shows a significant positive correlation between the proportion of Chippewa and unemployment rate among youth under the age of 25 in the United States with a correlation coefficient (R) of 0.643 and weighted average of 13.5%, a difference of 19.5%.
Unemployment Among Youth under 25 years Correlation Summary
| Measurement | Immigrants from Norway | Chippewa |
| Minimum | 1.8% | 4.1% |
| Maximum | 41.8% | 100.0% |
| Range | 40.0% | 95.9% |
| Mean | 15.4% | 27.1% |
| Median | 11.3% | 17.0% |
| Interquartile 25% (IQ1) | 10.5% | 10.2% |
| Interquartile 75% (IQ3) | 20.9% | 33.3% |
| Interquartile Range (IQR) | 10.3% | 23.1% |
| Standard Deviation (Sample) | 10.7% | 24.6% |
| Standard Deviation (Population) | 10.4% | 24.5% |
Similar Demographics by Unemployment Among Youth under 25 years
Demographics Similar to Immigrants from Norway by Unemployment Among Youth under 25 years
In terms of unemployment among youth under 25 years, the demographic groups most similar to Immigrants from Norway are Iranian (11.3%, a difference of 0.070%), Immigrants from France (11.3%, a difference of 0.14%), Immigrants from Austria (11.3%, a difference of 0.14%), Fijian (11.3%, a difference of 0.15%), and Immigrants from Ethiopia (11.3%, a difference of 0.19%).
| Demographics | Rating | Rank | Unemployment Among Youth under 25 years |
| Immigrants | Malaysia | 93.6 /100 | #103 | Exceptional 11.3% |
| Immigrants | Afghanistan | 93.4 /100 | #104 | Exceptional 11.3% |
| Immigrants | Jordan | 93.1 /100 | #105 | Exceptional 11.3% |
| Chileans | 93.0 /100 | #106 | Exceptional 11.3% |
| Immigrants | Lithuania | 92.9 /100 | #107 | Exceptional 11.3% |
| Immigrants | Kuwait | 92.9 /100 | #108 | Exceptional 11.3% |
| Iranians | 92.0 /100 | #109 | Exceptional 11.3% |
| Immigrants | Norway | 91.5 /100 | #110 | Exceptional 11.3% |
| Immigrants | France | 90.3 /100 | #111 | Exceptional 11.3% |
| Immigrants | Austria | 90.3 /100 | #112 | Exceptional 11.3% |
| Fijians | 90.2 /100 | #113 | Exceptional 11.3% |
| Immigrants | Ethiopia | 89.9 /100 | #114 | Excellent 11.3% |
| Immigrants | Vietnam | 89.9 /100 | #115 | Excellent 11.3% |
| Burmese | 89.8 /100 | #116 | Excellent 11.3% |
| Sri Lankans | 89.8 /100 | #117 | Excellent 11.3% |
Demographics Similar to Chippewa by Unemployment Among Youth under 25 years
In terms of unemployment among youth under 25 years, the demographic groups most similar to Chippewa are Senegalese (13.5%, a difference of 0.020%), Immigrants from Caribbean (13.5%, a difference of 0.24%), Spanish American Indian (13.5%, a difference of 0.40%), Central American Indian (13.5%, a difference of 0.51%), and Apache (13.5%, a difference of 0.54%).
| Demographics | Rating | Rank | Unemployment Among Youth under 25 years |
| Immigrants | Western Africa | 0.0 /100 | #288 | Tragic 13.4% |
| Immigrants | Ghana | 0.0 /100 | #289 | Tragic 13.4% |
| Immigrants | Ecuador | 0.0 /100 | #290 | Tragic 13.4% |
| Apache | 0.0 /100 | #291 | Tragic 13.5% |
| Central American Indians | 0.0 /100 | #292 | Tragic 13.5% |
| Spanish American Indians | 0.0 /100 | #293 | Tragic 13.5% |
| Immigrants | Caribbean | 0.0 /100 | #294 | Tragic 13.5% |
| Chippewa | 0.0 /100 | #295 | Tragic 13.5% |
| Senegalese | 0.0 /100 | #296 | Tragic 13.5% |
| U.S. Virgin Islanders | 0.0 /100 | #297 | Tragic 13.6% |
| Shoshone | 0.0 /100 | #298 | Tragic 13.7% |
| Tohono O'odham | 0.0 /100 | #299 | Tragic 13.8% |
| Immigrants | Cabo Verde | 0.0 /100 | #300 | Tragic 13.8% |
| Immigrants | Senegal | 0.0 /100 | #301 | Tragic 13.8% |
| Immigrants | Sierra Leone | 0.0 /100 | #302 | Tragic 13.8% |