Immigrants from Northern Europe vs Immigrants from Uganda Unemployment Among Ages 35 to 44 years
COMPARE
Immigrants from Northern Europe
Immigrants from Uganda
Unemployment Among Ages 35 to 44 years
Unemployment Among Ages 35 to 44 years Comparison
Immigrants from Northern Europe
Immigrants from Uganda
4.5%
UNEMPLOYMENT AMONG AGES 35 TO 44 YEARS
94.3/ 100
METRIC RATING
91st/ 347
METRIC RANK
4.7%
UNEMPLOYMENT AMONG AGES 35 TO 44 YEARS
48.1/ 100
METRIC RATING
176th/ 347
METRIC RANK
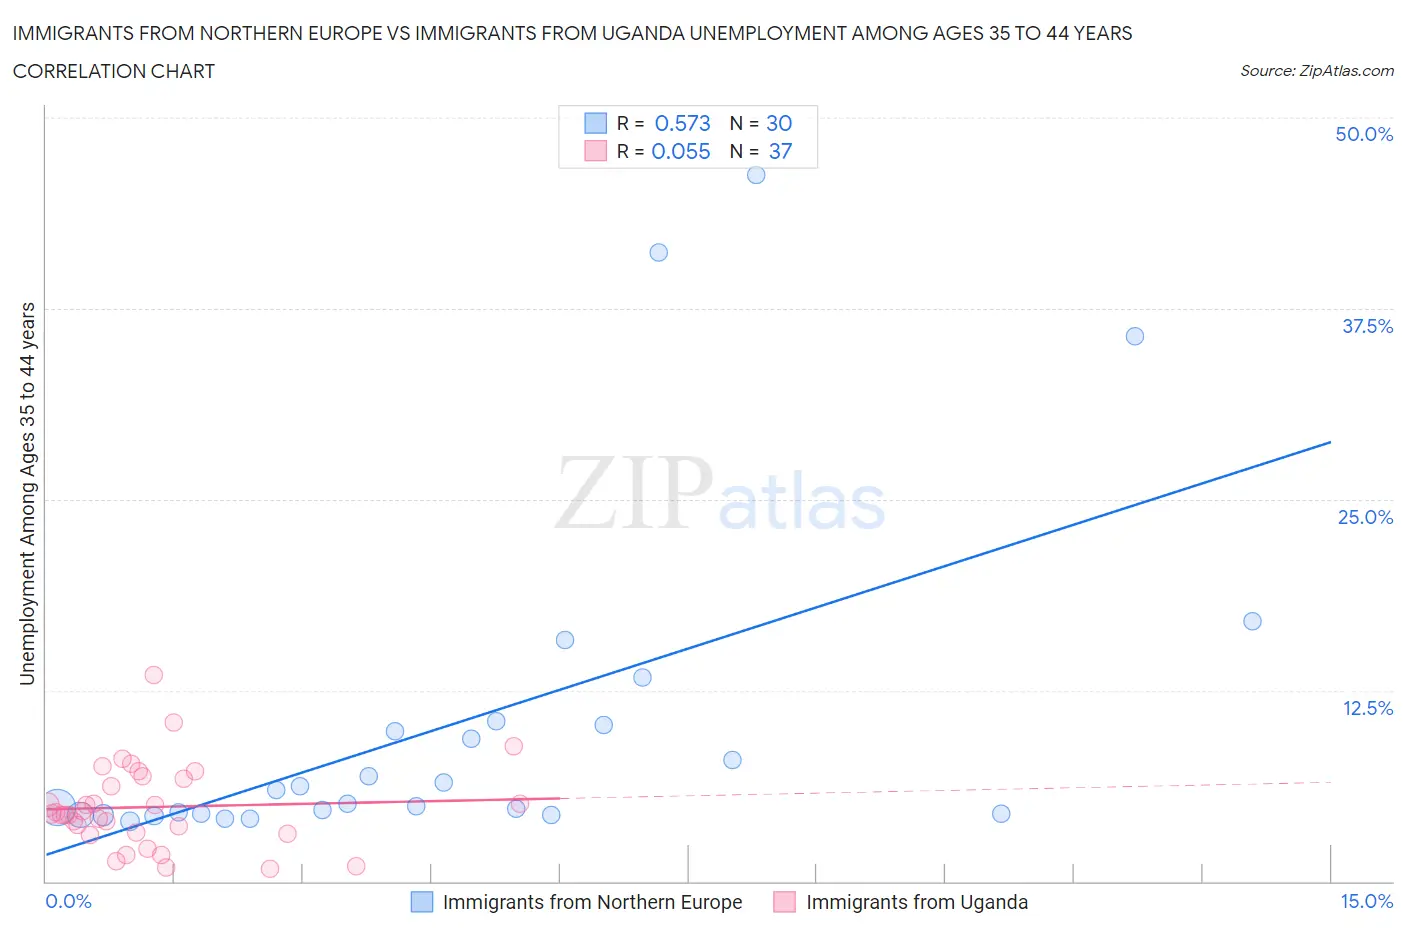
Immigrants from Northern Europe vs Immigrants from Uganda Unemployment Among Ages 35 to 44 years Correlation Chart
The statistical analysis conducted on geographies consisting of 459,843,354 people shows a substantial positive correlation between the proportion of Immigrants from Northern Europe and unemployment rate among population between the ages 35 and 44 in the United States with a correlation coefficient (R) of 0.573 and weighted average of 4.5%. Similarly, the statistical analysis conducted on geographies consisting of 125,256,740 people shows a slight positive correlation between the proportion of Immigrants from Uganda and unemployment rate among population between the ages 35 and 44 in the United States with a correlation coefficient (R) of 0.055 and weighted average of 4.7%, a difference of 5.4%.
Unemployment Among Ages 35 to 44 years Correlation Summary
| Measurement | Immigrants from Northern Europe | Immigrants from Uganda |
| Minimum | 4.0% | 0.80% |
| Maximum | 46.2% | 13.5% |
| Range | 42.2% | 12.7% |
| Mean | 10.3% | 4.9% |
| Median | 5.5% | 4.4% |
| Interquartile 25% (IQ1) | 4.4% | 3.2% |
| Interquartile 75% (IQ3) | 10.2% | 6.8% |
| Interquartile Range (IQR) | 5.8% | 3.6% |
| Standard Deviation (Sample) | 11.1% | 2.7% |
| Standard Deviation (Population) | 10.9% | 2.7% |
Similar Demographics by Unemployment Among Ages 35 to 44 years
Demographics Similar to Immigrants from Northern Europe by Unemployment Among Ages 35 to 44 years
In terms of unemployment among ages 35 to 44 years, the demographic groups most similar to Immigrants from Northern Europe are Estonian (4.5%, a difference of 0.010%), Australian (4.5%, a difference of 0.070%), Egyptian (4.5%, a difference of 0.090%), Iranian (4.5%, a difference of 0.13%), and Immigrants from Latvia (4.4%, a difference of 0.18%).
| Demographics | Rating | Rank | Unemployment Among Ages 35 to 44 years |
| Immigrants | Chile | 95.2 /100 | #84 | Exceptional 4.4% |
| Immigrants | Kenya | 95.0 /100 | #85 | Exceptional 4.4% |
| Serbians | 94.9 /100 | #86 | Exceptional 4.4% |
| Immigrants | Bosnia and Herzegovina | 94.8 /100 | #87 | Exceptional 4.4% |
| Immigrants | Latvia | 94.8 /100 | #88 | Exceptional 4.4% |
| Egyptians | 94.5 /100 | #89 | Exceptional 4.5% |
| Australians | 94.5 /100 | #90 | Exceptional 4.5% |
| Immigrants | Northern Europe | 94.3 /100 | #91 | Exceptional 4.5% |
| Estonians | 94.3 /100 | #92 | Exceptional 4.5% |
| Iranians | 93.9 /100 | #93 | Exceptional 4.5% |
| Russians | 93.8 /100 | #94 | Exceptional 4.5% |
| Yugoslavians | 93.6 /100 | #95 | Exceptional 4.5% |
| Scottish | 93.5 /100 | #96 | Exceptional 4.5% |
| Immigrants | France | 92.5 /100 | #97 | Exceptional 4.5% |
| Immigrants | Canada | 92.3 /100 | #98 | Exceptional 4.5% |
Demographics Similar to Immigrants from Uganda by Unemployment Among Ages 35 to 44 years
In terms of unemployment among ages 35 to 44 years, the demographic groups most similar to Immigrants from Uganda are Immigrants from Germany (4.7%, a difference of 0.060%), Afghan (4.7%, a difference of 0.14%), Iraqi (4.7%, a difference of 0.20%), Lebanese (4.7%, a difference of 0.23%), and Slovak (4.7%, a difference of 0.25%).
| Demographics | Rating | Rank | Unemployment Among Ages 35 to 44 years |
| Pennsylvania Germans | 53.0 /100 | #169 | Average 4.7% |
| Immigrants | Indonesia | 52.6 /100 | #170 | Average 4.7% |
| Indonesians | 51.7 /100 | #171 | Average 4.7% |
| Lebanese | 51.4 /100 | #172 | Average 4.7% |
| Iraqis | 50.9 /100 | #173 | Average 4.7% |
| Afghans | 50.0 /100 | #174 | Average 4.7% |
| Immigrants | Germany | 48.9 /100 | #175 | Average 4.7% |
| Immigrants | Uganda | 48.1 /100 | #176 | Average 4.7% |
| Slovaks | 44.6 /100 | #177 | Average 4.7% |
| South American Indians | 40.7 /100 | #178 | Average 4.7% |
| Immigrants | South Eastern Asia | 40.2 /100 | #179 | Average 4.7% |
| Immigrants | Peru | 39.9 /100 | #180 | Fair 4.7% |
| Brazilians | 39.5 /100 | #181 | Fair 4.7% |
| Israelis | 38.5 /100 | #182 | Fair 4.7% |
| Immigrants | Poland | 37.9 /100 | #183 | Fair 4.7% |