Immigrants from Northern Africa vs Salvadoran Unemployment Among Ages 30 to 34 years
COMPARE
Immigrants from Northern Africa
Salvadoran
Unemployment Among Ages 30 to 34 years
Unemployment Among Ages 30 to 34 years Comparison
Immigrants from Northern Africa
Salvadorans
5.1%
UNEMPLOYMENT AMONG AGES 30 TO 34 YEARS
96.4/ 100
METRIC RATING
69th/ 347
METRIC RANK
6.0%
UNEMPLOYMENT AMONG AGES 30 TO 34 YEARS
0.5/ 100
METRIC RATING
240th/ 347
METRIC RANK
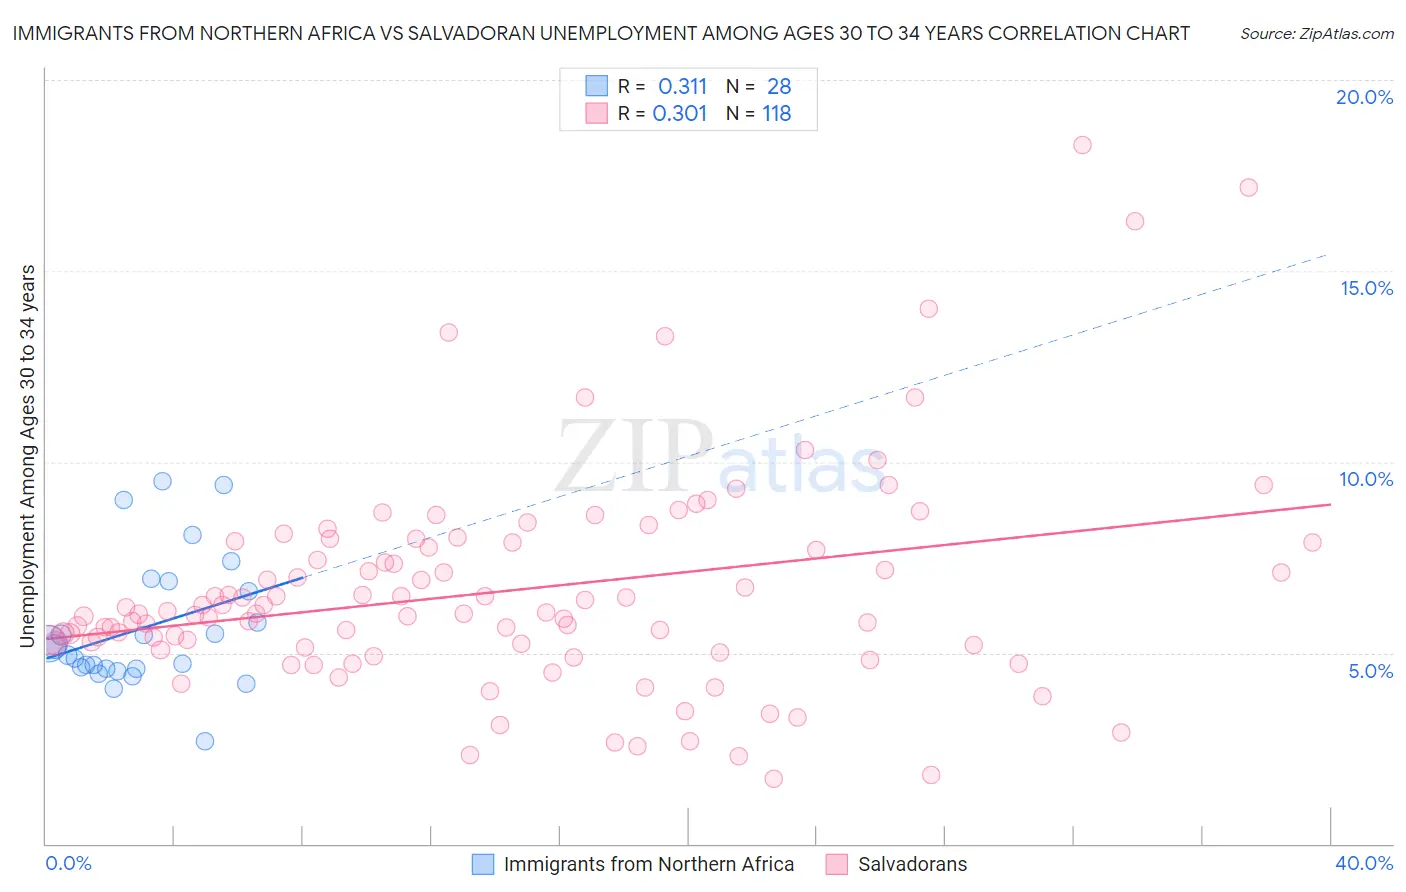
Immigrants from Northern Africa vs Salvadoran Unemployment Among Ages 30 to 34 years Correlation Chart
The statistical analysis conducted on geographies consisting of 308,082,224 people shows a mild positive correlation between the proportion of Immigrants from Northern Africa and unemployment rate among population between the ages 30 and 34 in the United States with a correlation coefficient (R) of 0.311 and weighted average of 5.1%. Similarly, the statistical analysis conducted on geographies consisting of 378,904,026 people shows a mild positive correlation between the proportion of Salvadorans and unemployment rate among population between the ages 30 and 34 in the United States with a correlation coefficient (R) of 0.301 and weighted average of 6.0%, a difference of 15.9%.
Unemployment Among Ages 30 to 34 years Correlation Summary
| Measurement | Immigrants from Northern Africa | Salvadoran |
| Minimum | 2.7% | 1.7% |
| Maximum | 9.5% | 18.3% |
| Range | 6.8% | 16.6% |
| Mean | 5.7% | 6.6% |
| Median | 5.0% | 6.0% |
| Interquartile 25% (IQ1) | 4.6% | 5.2% |
| Interquartile 75% (IQ3) | 6.7% | 7.9% |
| Interquartile Range (IQR) | 2.2% | 2.7% |
| Standard Deviation (Sample) | 1.7% | 2.8% |
| Standard Deviation (Population) | 1.7% | 2.8% |
Similar Demographics by Unemployment Among Ages 30 to 34 years
Demographics Similar to Immigrants from Northern Africa by Unemployment Among Ages 30 to 34 years
In terms of unemployment among ages 30 to 34 years, the demographic groups most similar to Immigrants from Northern Africa are Immigrants from Iraq (5.1%, a difference of 0.0%), Jordanian (5.1%, a difference of 0.010%), Paraguayan (5.1%, a difference of 0.010%), Burmese (5.1%, a difference of 0.020%), and Immigrants from Moldova (5.1%, a difference of 0.020%).
| Demographics | Rating | Rank | Unemployment Among Ages 30 to 34 years |
| Immigrants | France | 97.0 /100 | #62 | Exceptional 5.1% |
| Belgians | 97.0 /100 | #63 | Exceptional 5.1% |
| Immigrants | Eastern Asia | 96.9 /100 | #64 | Exceptional 5.1% |
| Immigrants | Japan | 96.8 /100 | #65 | Exceptional 5.1% |
| Immigrants | Zimbabwe | 96.7 /100 | #66 | Exceptional 5.1% |
| Burmese | 96.5 /100 | #67 | Exceptional 5.1% |
| Jordanians | 96.5 /100 | #68 | Exceptional 5.1% |
| Immigrants | Northern Africa | 96.4 /100 | #69 | Exceptional 5.1% |
| Immigrants | Iraq | 96.4 /100 | #70 | Exceptional 5.1% |
| Paraguayans | 96.4 /100 | #71 | Exceptional 5.1% |
| Immigrants | Moldova | 96.4 /100 | #72 | Exceptional 5.1% |
| Slovenes | 96.2 /100 | #73 | Exceptional 5.2% |
| Immigrants | Asia | 96.2 /100 | #74 | Exceptional 5.2% |
| Iranians | 96.0 /100 | #75 | Exceptional 5.2% |
| Scandinavians | 95.6 /100 | #76 | Exceptional 5.2% |
Demographics Similar to Salvadorans by Unemployment Among Ages 30 to 34 years
In terms of unemployment among ages 30 to 34 years, the demographic groups most similar to Salvadorans are Immigrants from El Salvador (6.0%, a difference of 0.070%), Immigrants from Nigeria (6.0%, a difference of 0.26%), Guatemalan (6.0%, a difference of 0.30%), Mexican American Indian (5.9%, a difference of 0.33%), and Immigrants from Liberia (6.0%, a difference of 0.36%).
| Demographics | Rating | Rank | Unemployment Among Ages 30 to 34 years |
| Nepalese | 0.8 /100 | #233 | Tragic 5.9% |
| Portuguese | 0.8 /100 | #234 | Tragic 5.9% |
| Yaqui | 0.7 /100 | #235 | Tragic 5.9% |
| Native Hawaiians | 0.7 /100 | #236 | Tragic 5.9% |
| Central Americans | 0.6 /100 | #237 | Tragic 5.9% |
| Mexican American Indians | 0.6 /100 | #238 | Tragic 5.9% |
| Immigrants | Nigeria | 0.6 /100 | #239 | Tragic 6.0% |
| Salvadorans | 0.5 /100 | #240 | Tragic 6.0% |
| Immigrants | El Salvador | 0.5 /100 | #241 | Tragic 6.0% |
| Guatemalans | 0.4 /100 | #242 | Tragic 6.0% |
| Immigrants | Liberia | 0.4 /100 | #243 | Tragic 6.0% |
| Immigrants | Micronesia | 0.3 /100 | #244 | Tragic 6.0% |
| Sub-Saharan Africans | 0.3 /100 | #245 | Tragic 6.0% |
| Ghanaians | 0.3 /100 | #246 | Tragic 6.0% |
| Nigerians | 0.3 /100 | #247 | Tragic 6.0% |