Immigrants from Northern Africa vs Maltese Unemployment Among Ages 65 to 74 years
COMPARE
Immigrants from Northern Africa
Maltese
Unemployment Among Ages 65 to 74 years
Unemployment Among Ages 65 to 74 years Comparison
Immigrants from Northern Africa
Maltese
5.5%
UNEMPLOYMENT AMONG AGES 65 TO 74 YEARS
10.1/ 100
METRIC RATING
210th/ 347
METRIC RANK
5.4%
UNEMPLOYMENT AMONG AGES 65 TO 74 YEARS
26.4/ 100
METRIC RATING
192nd/ 347
METRIC RANK
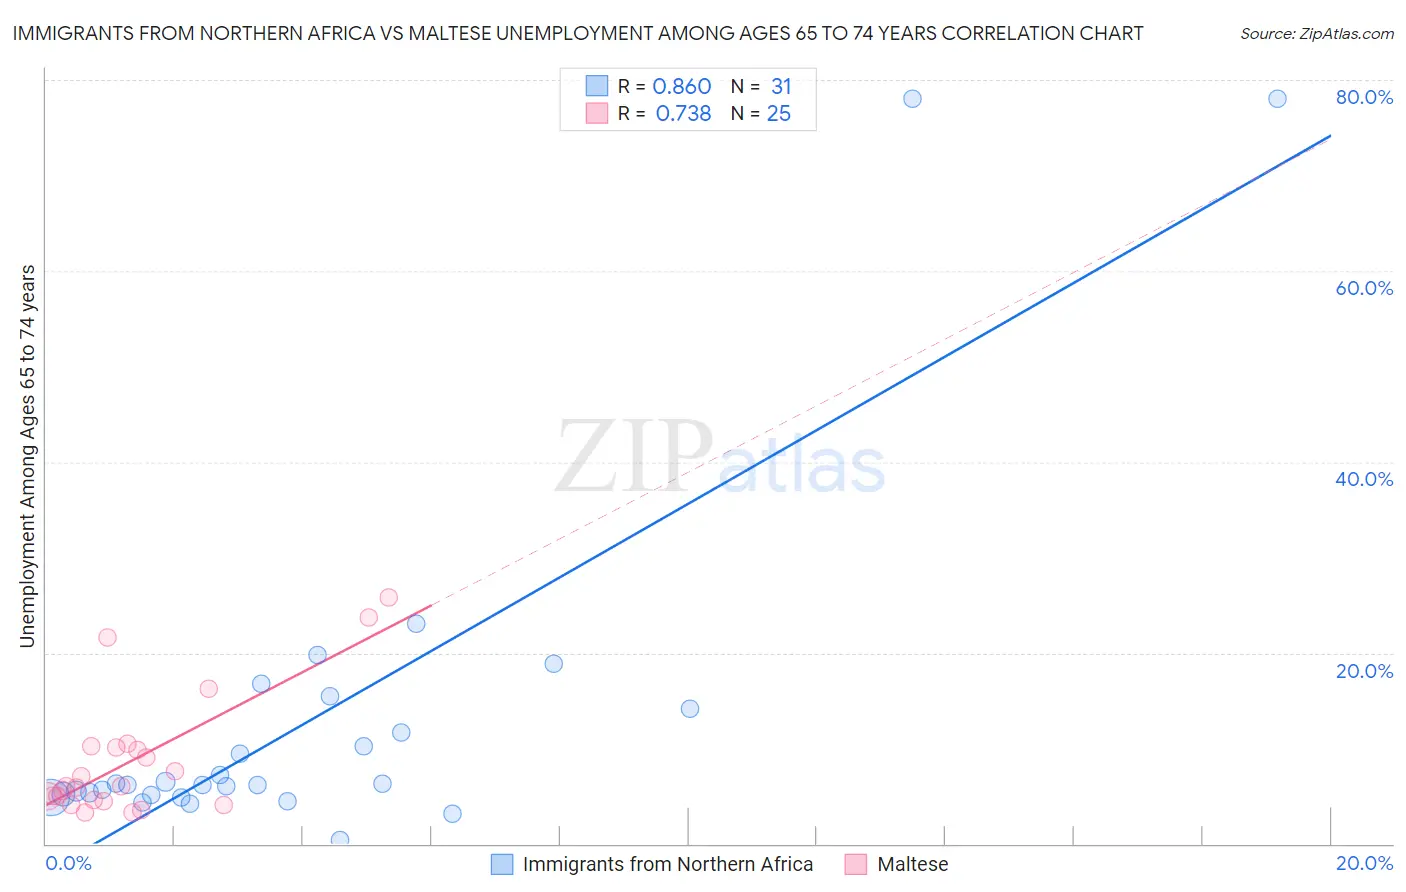
Immigrants from Northern Africa vs Maltese Unemployment Among Ages 65 to 74 years Correlation Chart
The statistical analysis conducted on geographies consisting of 294,217,459 people shows a very strong positive correlation between the proportion of Immigrants from Northern Africa and unemployment rate among population between the ages 65 and 74 in the United States with a correlation coefficient (R) of 0.860 and weighted average of 5.5%. Similarly, the statistical analysis conducted on geographies consisting of 120,596,367 people shows a strong positive correlation between the proportion of Maltese and unemployment rate among population between the ages 65 and 74 in the United States with a correlation coefficient (R) of 0.738 and weighted average of 5.4%, a difference of 0.96%.
Unemployment Among Ages 65 to 74 years Correlation Summary
| Measurement | Immigrants from Northern Africa | Maltese |
| Minimum | 0.33% | 3.2% |
| Maximum | 78.0% | 25.8% |
| Range | 77.7% | 22.6% |
| Mean | 12.9% | 8.7% |
| Median | 6.2% | 6.0% |
| Interquartile 25% (IQ1) | 5.1% | 4.5% |
| Interquartile 75% (IQ3) | 14.2% | 10.2% |
| Interquartile Range (IQR) | 9.1% | 5.6% |
| Standard Deviation (Sample) | 18.2% | 6.4% |
| Standard Deviation (Population) | 17.9% | 6.3% |
Demographics Similar to Immigrants from Northern Africa and Maltese by Unemployment Among Ages 65 to 74 years
In terms of unemployment among ages 65 to 74 years, the demographic groups most similar to Immigrants from Northern Africa are Immigrants from Honduras (5.5%, a difference of 0.030%), Immigrants from Croatia (5.5%, a difference of 0.10%), Dutch West Indian (5.5%, a difference of 0.12%), Immigrants from Uzbekistan (5.5%, a difference of 0.20%), and African (5.5%, a difference of 0.23%). Similarly, the demographic groups most similar to Maltese are Immigrants from Egypt (5.4%, a difference of 0.010%), Cherokee (5.4%, a difference of 0.030%), Immigrants from Denmark (5.4%, a difference of 0.080%), Immigrants from China (5.4%, a difference of 0.10%), and Costa Rican (5.4%, a difference of 0.25%).
| Demographics | Rating | Rank | Unemployment Among Ages 65 to 74 years |
| Immigrants | Egypt | 26.5 /100 | #191 | Fair 5.4% |
| Maltese | 26.4 /100 | #192 | Fair 5.4% |
| Cherokee | 25.8 /100 | #193 | Fair 5.4% |
| Immigrants | Denmark | 24.7 /100 | #194 | Fair 5.4% |
| Immigrants | China | 24.2 /100 | #195 | Fair 5.4% |
| Costa Ricans | 21.1 /100 | #196 | Fair 5.4% |
| Colville | 20.4 /100 | #197 | Fair 5.4% |
| Albanians | 17.8 /100 | #198 | Poor 5.4% |
| Immigrants | Belgium | 16.2 /100 | #199 | Poor 5.4% |
| Immigrants | Pakistan | 15.2 /100 | #200 | Poor 5.4% |
| Immigrants | Western Asia | 14.9 /100 | #201 | Poor 5.4% |
| Sub-Saharan Africans | 14.4 /100 | #202 | Poor 5.4% |
| Argentineans | 14.3 /100 | #203 | Poor 5.4% |
| Seminole | 14.3 /100 | #204 | Poor 5.4% |
| Icelanders | 14.2 /100 | #205 | Poor 5.4% |
| Africans | 12.8 /100 | #206 | Poor 5.5% |
| Immigrants | Uzbekistan | 12.5 /100 | #207 | Poor 5.5% |
| Dutch West Indians | 11.5 /100 | #208 | Poor 5.5% |
| Immigrants | Honduras | 10.4 /100 | #209 | Poor 5.5% |
| Immigrants | Northern Africa | 10.1 /100 | #210 | Poor 5.5% |
| Immigrants | Croatia | 9.1 /100 | #211 | Tragic 5.5% |