Immigrants from Northern Africa vs Jordanian Male Unemployment
COMPARE
Immigrants from Northern Africa
Jordanian
Male Unemployment
Male Unemployment Comparison
Immigrants from Northern Africa
Jordanians
5.2%
MALE UNEMPLOYMENT
72.3/ 100
METRIC RATING
157th/ 347
METRIC RANK
5.0%
MALE UNEMPLOYMENT
98.8/ 100
METRIC RATING
53rd/ 347
METRIC RANK
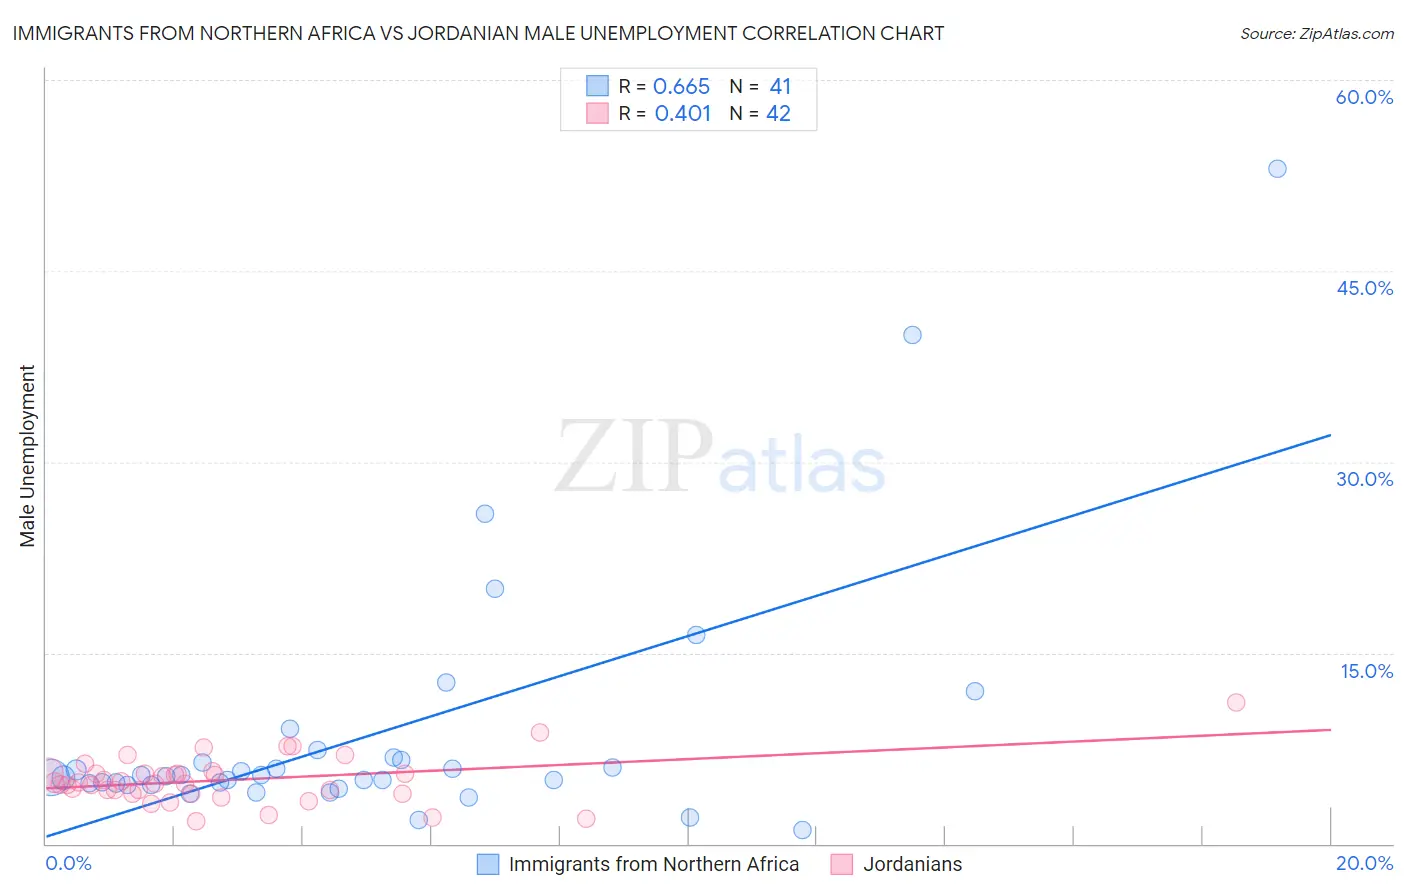
Immigrants from Northern Africa vs Jordanian Male Unemployment Correlation Chart
The statistical analysis conducted on geographies consisting of 320,554,315 people shows a significant positive correlation between the proportion of Immigrants from Northern Africa and unemployment rate among males in the United States with a correlation coefficient (R) of 0.665 and weighted average of 5.2%. Similarly, the statistical analysis conducted on geographies consisting of 166,295,233 people shows a moderate positive correlation between the proportion of Jordanians and unemployment rate among males in the United States with a correlation coefficient (R) of 0.401 and weighted average of 5.0%, a difference of 5.4%.
Male Unemployment Correlation Summary
| Measurement | Immigrants from Northern Africa | Jordanian |
| Minimum | 1.1% | 1.8% |
| Maximum | 53.0% | 11.1% |
| Range | 51.9% | 9.3% |
| Mean | 8.6% | 5.0% |
| Median | 5.3% | 4.7% |
| Interquartile 25% (IQ1) | 4.7% | 4.0% |
| Interquartile 75% (IQ3) | 6.7% | 5.5% |
| Interquartile Range (IQR) | 2.0% | 1.6% |
| Standard Deviation (Sample) | 10.0% | 1.8% |
| Standard Deviation (Population) | 9.9% | 1.8% |
Similar Demographics by Male Unemployment
Demographics Similar to Immigrants from Northern Africa by Male Unemployment
In terms of male unemployment, the demographic groups most similar to Immigrants from Northern Africa are American (5.2%, a difference of 0.030%), Immigrants from Indonesia (5.2%, a difference of 0.050%), Immigrants from Hungary (5.2%, a difference of 0.080%), Indonesian (5.2%, a difference of 0.080%), and Immigrants from Norway (5.2%, a difference of 0.090%).
| Demographics | Rating | Rank | Male Unemployment |
| Indians (Asian) | 76.0 /100 | #150 | Good 5.2% |
| Slovaks | 75.5 /100 | #151 | Good 5.2% |
| Egyptians | 74.8 /100 | #152 | Good 5.2% |
| Immigrants | Uruguay | 73.9 /100 | #153 | Good 5.2% |
| Laotians | 73.8 /100 | #154 | Good 5.2% |
| Immigrants | Hungary | 73.4 /100 | #155 | Good 5.2% |
| Americans | 72.7 /100 | #156 | Good 5.2% |
| Immigrants | Northern Africa | 72.3 /100 | #157 | Good 5.2% |
| Immigrants | Indonesia | 71.5 /100 | #158 | Good 5.2% |
| Indonesians | 71.2 /100 | #159 | Good 5.2% |
| Immigrants | Norway | 71.0 /100 | #160 | Good 5.2% |
| Immigrants | China | 70.6 /100 | #161 | Good 5.2% |
| Immigrants | Egypt | 65.9 /100 | #162 | Good 5.2% |
| Immigrants | Hong Kong | 65.7 /100 | #163 | Good 5.2% |
| Afghans | 62.0 /100 | #164 | Good 5.3% |
Demographics Similar to Jordanians by Male Unemployment
In terms of male unemployment, the demographic groups most similar to Jordanians are Irish (5.0%, a difference of 0.060%), Slovene (5.0%, a difference of 0.080%), Yugoslavian (5.0%, a difference of 0.10%), Croatian (4.9%, a difference of 0.11%), and Czechoslovakian (5.0%, a difference of 0.11%).
| Demographics | Rating | Rank | Male Unemployment |
| Bhutanese | 98.9 /100 | #46 | Exceptional 4.9% |
| Austrians | 98.9 /100 | #47 | Exceptional 4.9% |
| Immigrants | Scotland | 98.9 /100 | #48 | Exceptional 4.9% |
| Poles | 98.9 /100 | #49 | Exceptional 4.9% |
| Croatians | 98.9 /100 | #50 | Exceptional 4.9% |
| Slovenes | 98.8 /100 | #51 | Exceptional 5.0% |
| Irish | 98.8 /100 | #52 | Exceptional 5.0% |
| Jordanians | 98.8 /100 | #53 | Exceptional 5.0% |
| Yugoslavians | 98.7 /100 | #54 | Exceptional 5.0% |
| Czechoslovakians | 98.7 /100 | #55 | Exceptional 5.0% |
| Immigrants | Bulgaria | 98.7 /100 | #56 | Exceptional 5.0% |
| Turks | 98.5 /100 | #57 | Exceptional 5.0% |
| Lithuanians | 98.5 /100 | #58 | Exceptional 5.0% |
| Immigrants | Netherlands | 98.3 /100 | #59 | Exceptional 5.0% |
| Immigrants | Argentina | 98.1 /100 | #60 | Exceptional 5.0% |