Immigrants from Northern Africa vs Immigrants from Northern Europe Unemployment Among Seniors over 75 years
COMPARE
Immigrants from Northern Africa
Immigrants from Northern Europe
Unemployment Among Seniors over 75 years
Unemployment Among Seniors over 75 years Comparison
Immigrants from Northern Africa
Immigrants from Northern Europe
8.2%
UNEMPLOYMENT AMONG SENIORS OVER 75 YEARS
99.3/ 100
METRIC RATING
98th/ 347
METRIC RANK
8.9%
UNEMPLOYMENT AMONG SENIORS OVER 75 YEARS
23.9/ 100
METRIC RATING
203rd/ 347
METRIC RANK
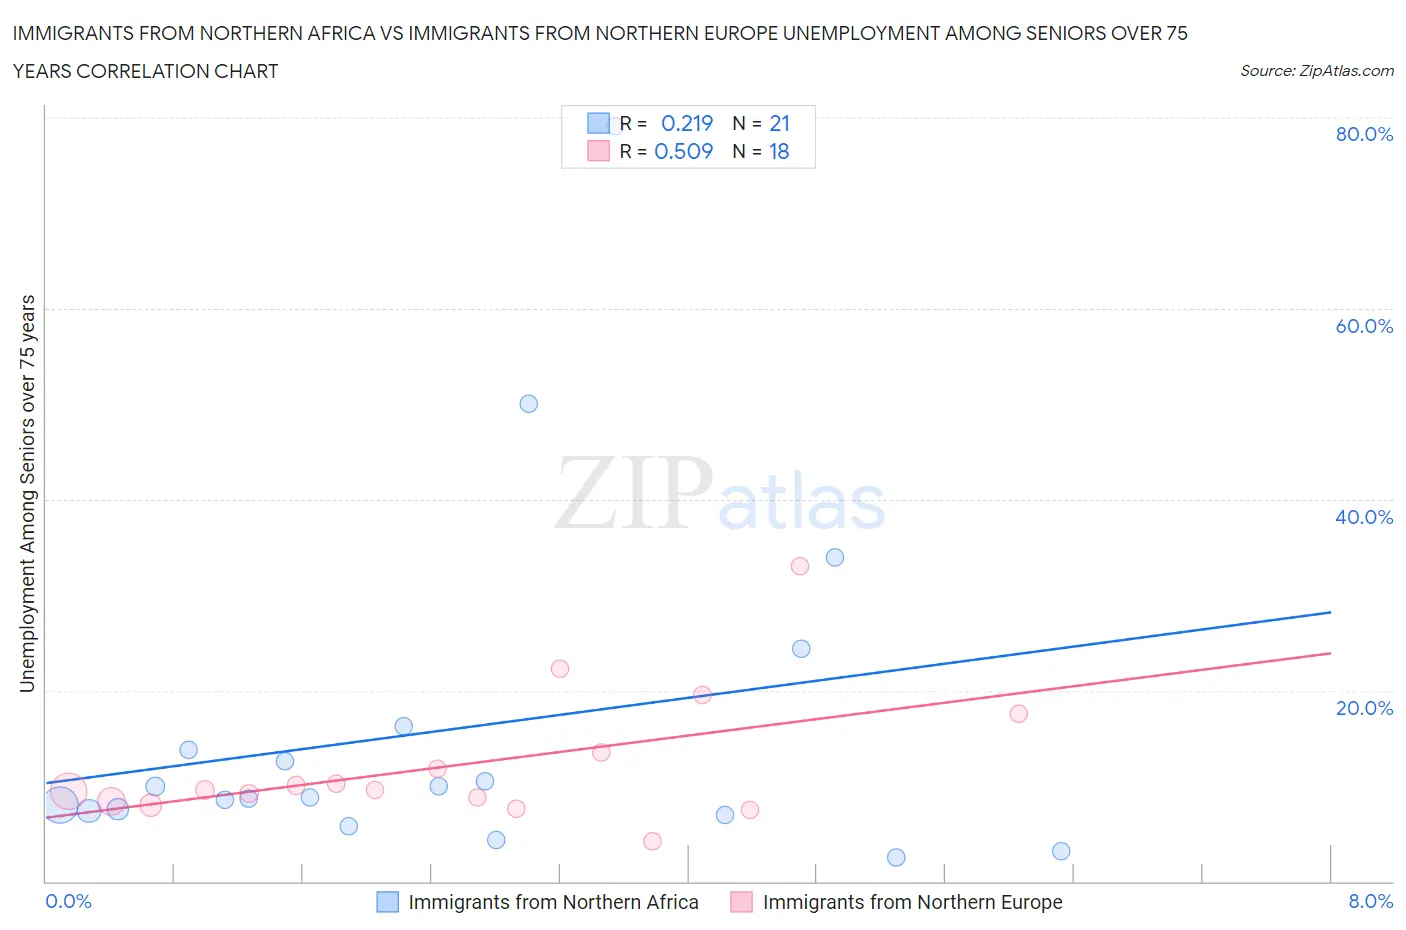
Immigrants from Northern Africa vs Immigrants from Northern Europe Unemployment Among Seniors over 75 years Correlation Chart
The statistical analysis conducted on geographies consisting of 181,749,712 people shows a weak positive correlation between the proportion of Immigrants from Northern Africa and unemployment rate among seniors over the age of 75 in the United States with a correlation coefficient (R) of 0.219 and weighted average of 8.2%. Similarly, the statistical analysis conducted on geographies consisting of 222,862,260 people shows a substantial positive correlation between the proportion of Immigrants from Northern Europe and unemployment rate among seniors over the age of 75 in the United States with a correlation coefficient (R) of 0.509 and weighted average of 8.9%, a difference of 8.7%.
Unemployment Among Seniors over 75 years Correlation Summary
| Measurement | Immigrants from Northern Africa | Immigrants from Northern Europe |
| Minimum | 2.5% | 4.2% |
| Maximum | 79.1% | 33.0% |
| Range | 76.6% | 28.8% |
| Mean | 15.8% | 12.2% |
| Median | 8.8% | 9.6% |
| Interquartile 25% (IQ1) | 7.1% | 8.4% |
| Interquartile 75% (IQ3) | 15.0% | 13.5% |
| Interquartile Range (IQR) | 7.9% | 5.1% |
| Standard Deviation (Sample) | 18.3% | 6.9% |
| Standard Deviation (Population) | 17.8% | 6.7% |
Similar Demographics by Unemployment Among Seniors over 75 years
Demographics Similar to Immigrants from Northern Africa by Unemployment Among Seniors over 75 years
In terms of unemployment among seniors over 75 years, the demographic groups most similar to Immigrants from Northern Africa are Immigrants from Sri Lanka (8.2%, a difference of 0.040%), Burmese (8.2%, a difference of 0.090%), Immigrants from Kazakhstan (8.2%, a difference of 0.10%), Immigrants from Belgium (8.2%, a difference of 0.12%), and Nicaraguan (8.2%, a difference of 0.14%).
| Demographics | Rating | Rank | Unemployment Among Seniors over 75 years |
| Egyptians | 99.5 /100 | #91 | Exceptional 8.1% |
| Venezuelans | 99.5 /100 | #92 | Exceptional 8.1% |
| Immigrants | Netherlands | 99.5 /100 | #93 | Exceptional 8.1% |
| Immigrants | Ireland | 99.4 /100 | #94 | Exceptional 8.1% |
| Nicaraguans | 99.3 /100 | #95 | Exceptional 8.2% |
| Immigrants | Belgium | 99.3 /100 | #96 | Exceptional 8.2% |
| Immigrants | Sri Lanka | 99.3 /100 | #97 | Exceptional 8.2% |
| Immigrants | Northern Africa | 99.3 /100 | #98 | Exceptional 8.2% |
| Burmese | 99.2 /100 | #99 | Exceptional 8.2% |
| Immigrants | Kazakhstan | 99.2 /100 | #100 | Exceptional 8.2% |
| Immigrants | Serbia | 99.2 /100 | #101 | Exceptional 8.2% |
| Immigrants | Panama | 99.1 /100 | #102 | Exceptional 8.2% |
| South American Indians | 99.1 /100 | #103 | Exceptional 8.2% |
| Immigrants | South Central Asia | 99.0 /100 | #104 | Exceptional 8.2% |
| Immigrants | Caribbean | 99.0 /100 | #105 | Exceptional 8.2% |
Demographics Similar to Immigrants from Northern Europe by Unemployment Among Seniors over 75 years
In terms of unemployment among seniors over 75 years, the demographic groups most similar to Immigrants from Northern Europe are Russian (8.9%, a difference of 0.020%), Immigrants from Peru (8.9%, a difference of 0.030%), Pakistani (8.9%, a difference of 0.11%), Osage (8.9%, a difference of 0.11%), and Eastern European (8.9%, a difference of 0.14%).
| Demographics | Rating | Rank | Unemployment Among Seniors over 75 years |
| Immigrants | Jamaica | 27.7 /100 | #196 | Fair 8.9% |
| Immigrants | Laos | 26.3 /100 | #197 | Fair 8.9% |
| Eastern Europeans | 25.9 /100 | #198 | Fair 8.9% |
| Pakistanis | 25.4 /100 | #199 | Fair 8.9% |
| Osage | 25.4 /100 | #200 | Fair 8.9% |
| Immigrants | Peru | 24.3 /100 | #201 | Fair 8.9% |
| Russians | 24.1 /100 | #202 | Fair 8.9% |
| Immigrants | Northern Europe | 23.9 /100 | #203 | Fair 8.9% |
| Spaniards | 22.0 /100 | #204 | Fair 8.9% |
| Koreans | 21.9 /100 | #205 | Fair 8.9% |
| Immigrants | Western Europe | 18.2 /100 | #206 | Poor 8.9% |
| Malaysians | 16.3 /100 | #207 | Poor 8.9% |
| Immigrants | Philippines | 15.8 /100 | #208 | Poor 8.9% |
| Salvadorans | 15.4 /100 | #209 | Poor 8.9% |
| Bermudans | 15.0 /100 | #210 | Poor 8.9% |