Immigrants from Northern Africa vs Immigrants from Armenia Unemployment Among Ages 16 to 19 years
COMPARE
Immigrants from Northern Africa
Immigrants from Armenia
Unemployment Among Ages 16 to 19 years
Unemployment Among Ages 16 to 19 years Comparison
Immigrants from Northern Africa
Immigrants from Armenia
17.4%
UNEMPLOYMENT AMONG AGES 16 TO 19 YEARS
69.0/ 100
METRIC RATING
152nd/ 347
METRIC RANK
22.6%
UNEMPLOYMENT AMONG AGES 16 TO 19 YEARS
0.0/ 100
METRIC RATING
324th/ 347
METRIC RANK
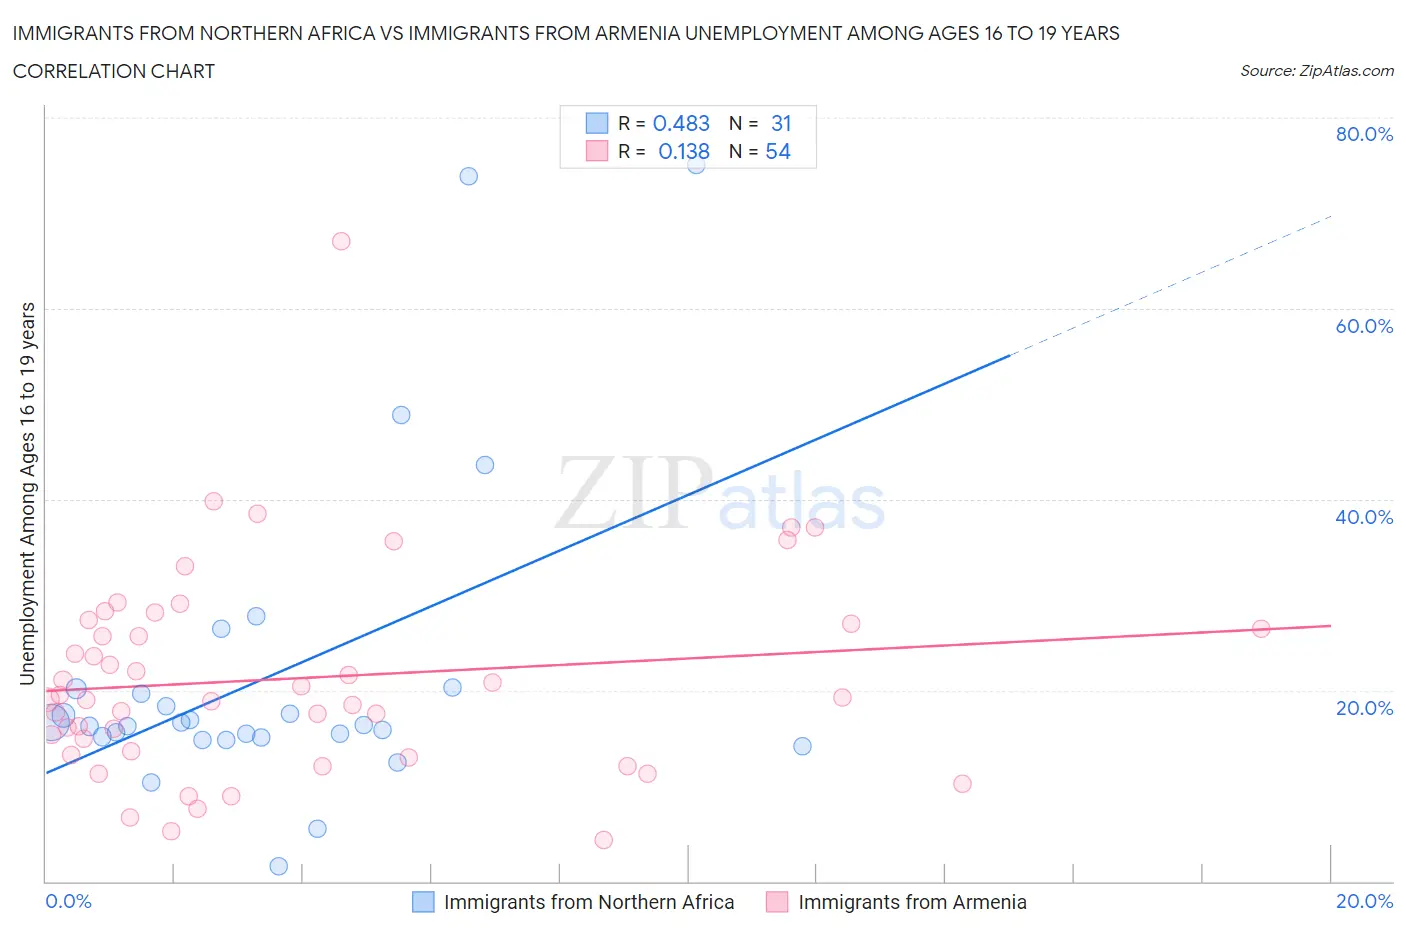
Immigrants from Northern Africa vs Immigrants from Armenia Unemployment Among Ages 16 to 19 years Correlation Chart
The statistical analysis conducted on geographies consisting of 309,515,333 people shows a moderate positive correlation between the proportion of Immigrants from Northern Africa and unemployment rate among population between the ages 16 and 19 in the United States with a correlation coefficient (R) of 0.483 and weighted average of 17.4%. Similarly, the statistical analysis conducted on geographies consisting of 95,580,744 people shows a poor positive correlation between the proportion of Immigrants from Armenia and unemployment rate among population between the ages 16 and 19 in the United States with a correlation coefficient (R) of 0.138 and weighted average of 22.6%, a difference of 29.9%.
Unemployment Among Ages 16 to 19 years Correlation Summary
| Measurement | Immigrants from Northern Africa | Immigrants from Armenia |
| Minimum | 1.5% | 4.3% |
| Maximum | 75.0% | 67.0% |
| Range | 73.5% | 62.7% |
| Mean | 21.8% | 21.3% |
| Median | 16.4% | 19.2% |
| Interquartile 25% (IQ1) | 15.1% | 13.6% |
| Interquartile 75% (IQ3) | 20.2% | 27.0% |
| Interquartile Range (IQR) | 5.1% | 13.4% |
| Standard Deviation (Sample) | 16.7% | 10.9% |
| Standard Deviation (Population) | 16.4% | 10.8% |
Similar Demographics by Unemployment Among Ages 16 to 19 years
Demographics Similar to Immigrants from Northern Africa by Unemployment Among Ages 16 to 19 years
In terms of unemployment among ages 16 to 19 years, the demographic groups most similar to Immigrants from Northern Africa are Immigrants from Hong Kong (17.4%, a difference of 0.020%), Immigrants from Afghanistan (17.4%, a difference of 0.020%), Afghan (17.4%, a difference of 0.050%), Portuguese (17.4%, a difference of 0.090%), and Costa Rican (17.4%, a difference of 0.16%).
| Demographics | Rating | Rank | Unemployment Among Ages 16 to 19 years |
| Indians (Asian) | 77.6 /100 | #145 | Good 17.3% |
| Turks | 77.1 /100 | #146 | Good 17.3% |
| Tsimshian | 76.0 /100 | #147 | Good 17.3% |
| Romanians | 74.9 /100 | #148 | Good 17.3% |
| Immigrants | Eastern Asia | 73.8 /100 | #149 | Good 17.4% |
| Immigrants | Northern Europe | 72.5 /100 | #150 | Good 17.4% |
| Immigrants | Hong Kong | 69.3 /100 | #151 | Good 17.4% |
| Immigrants | Northern Africa | 69.0 /100 | #152 | Good 17.4% |
| Immigrants | Afghanistan | 68.6 /100 | #153 | Good 17.4% |
| Afghans | 68.1 /100 | #154 | Good 17.4% |
| Portuguese | 67.3 /100 | #155 | Good 17.4% |
| Costa Ricans | 65.9 /100 | #156 | Good 17.4% |
| Uruguayans | 64.3 /100 | #157 | Good 17.5% |
| Immigrants | China | 64.1 /100 | #158 | Good 17.5% |
| Koreans | 61.0 /100 | #159 | Good 17.5% |
Demographics Similar to Immigrants from Armenia by Unemployment Among Ages 16 to 19 years
In terms of unemployment among ages 16 to 19 years, the demographic groups most similar to Immigrants from Armenia are Trinidadian and Tobagonian (22.6%, a difference of 0.12%), Yakama (22.5%, a difference of 0.45%), Barbadian (22.5%, a difference of 0.68%), West Indian (22.4%, a difference of 0.81%), and Cheyenne (22.3%, a difference of 1.5%).
| Demographics | Rating | Rank | Unemployment Among Ages 16 to 19 years |
| Immigrants | Belize | 0.0 /100 | #317 | Tragic 22.2% |
| Immigrants | Jamaica | 0.0 /100 | #318 | Tragic 22.2% |
| Immigrants | West Indies | 0.0 /100 | #319 | Tragic 22.2% |
| Cheyenne | 0.0 /100 | #320 | Tragic 22.3% |
| West Indians | 0.0 /100 | #321 | Tragic 22.4% |
| Barbadians | 0.0 /100 | #322 | Tragic 22.5% |
| Yakama | 0.0 /100 | #323 | Tragic 22.5% |
| Immigrants | Armenia | 0.0 /100 | #324 | Tragic 22.6% |
| Trinidadians and Tobagonians | 0.0 /100 | #325 | Tragic 22.6% |
| Immigrants | Trinidad and Tobago | 0.0 /100 | #326 | Tragic 23.1% |
| Pima | 0.0 /100 | #327 | Tragic 23.1% |
| Immigrants | Dominican Republic | 0.0 /100 | #328 | Tragic 23.3% |
| Tlingit-Haida | 0.0 /100 | #329 | Tragic 23.5% |
| Dominicans | 0.0 /100 | #330 | Tragic 23.6% |
| British West Indians | 0.0 /100 | #331 | Tragic 24.0% |