Immigrants from Northern Africa vs Cape Verdean Unemployment Among Ages 45 to 54 years
COMPARE
Immigrants from Northern Africa
Cape Verdean
Unemployment Among Ages 45 to 54 years
Unemployment Among Ages 45 to 54 years Comparison
Immigrants from Northern Africa
Cape Verdeans
4.5%
UNEMPLOYMENT AMONG AGES 45 TO 54 YEARS
49.0/ 100
METRIC RATING
177th/ 347
METRIC RANK
5.7%
UNEMPLOYMENT AMONG AGES 45 TO 54 YEARS
0.0/ 100
METRIC RATING
319th/ 347
METRIC RANK
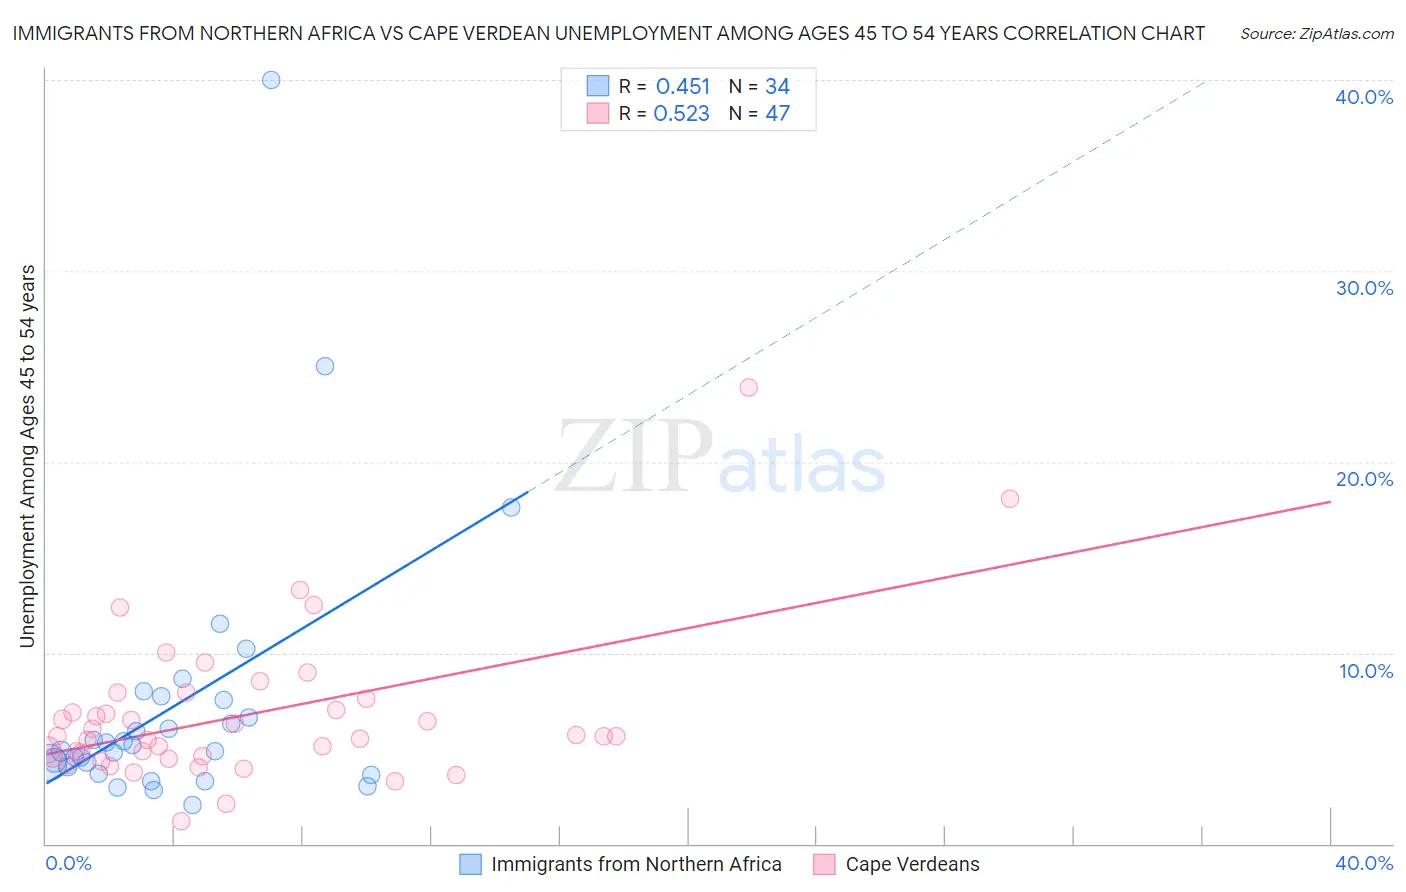
Immigrants from Northern Africa vs Cape Verdean Unemployment Among Ages 45 to 54 years Correlation Chart
The statistical analysis conducted on geographies consisting of 316,462,246 people shows a moderate positive correlation between the proportion of Immigrants from Northern Africa and unemployment rate among population between the ages 45 and 54 in the United States with a correlation coefficient (R) of 0.451 and weighted average of 4.5%. Similarly, the statistical analysis conducted on geographies consisting of 106,769,192 people shows a substantial positive correlation between the proportion of Cape Verdeans and unemployment rate among population between the ages 45 and 54 in the United States with a correlation coefficient (R) of 0.523 and weighted average of 5.7%, a difference of 26.0%.
Unemployment Among Ages 45 to 54 years Correlation Summary
| Measurement | Immigrants from Northern Africa | Cape Verdean |
| Minimum | 2.0% | 1.2% |
| Maximum | 40.0% | 23.9% |
| Range | 38.0% | 22.7% |
| Mean | 7.3% | 6.7% |
| Median | 5.0% | 5.6% |
| Interquartile 25% (IQ1) | 4.0% | 4.5% |
| Interquartile 75% (IQ3) | 7.5% | 7.6% |
| Interquartile Range (IQR) | 3.5% | 3.1% |
| Standard Deviation (Sample) | 7.3% | 4.0% |
| Standard Deviation (Population) | 7.2% | 3.9% |
Similar Demographics by Unemployment Among Ages 45 to 54 years
Demographics Similar to Immigrants from Northern Africa by Unemployment Among Ages 45 to 54 years
In terms of unemployment among ages 45 to 54 years, the demographic groups most similar to Immigrants from Northern Africa are Puget Sound Salish (4.5%, a difference of 0.0%), Immigrants from France (4.5%, a difference of 0.020%), Immigrants from Australia (4.5%, a difference of 0.020%), Immigrants from Russia (4.5%, a difference of 0.040%), and Immigrants from Hungary (4.5%, a difference of 0.050%).
| Demographics | Rating | Rank | Unemployment Among Ages 45 to 54 years |
| Spaniards | 54.3 /100 | #170 | Average 4.5% |
| Egyptians | 53.6 /100 | #171 | Average 4.5% |
| Colombians | 53.3 /100 | #172 | Average 4.5% |
| Immigrants | Colombia | 52.0 /100 | #173 | Average 4.5% |
| Immigrants | Hungary | 50.0 /100 | #174 | Average 4.5% |
| Immigrants | France | 49.4 /100 | #175 | Average 4.5% |
| Puget Sound Salish | 49.1 /100 | #176 | Average 4.5% |
| Immigrants | Northern Africa | 49.0 /100 | #177 | Average 4.5% |
| Immigrants | Australia | 48.5 /100 | #178 | Average 4.5% |
| Immigrants | Russia | 48.2 /100 | #179 | Average 4.5% |
| Malaysians | 47.5 /100 | #180 | Average 4.5% |
| Immigrants | Poland | 47.0 /100 | #181 | Average 4.5% |
| Immigrants | China | 46.7 /100 | #182 | Average 4.5% |
| Sierra Leoneans | 46.7 /100 | #183 | Average 4.5% |
| Immigrants | Hong Kong | 45.9 /100 | #184 | Average 4.5% |
Demographics Similar to Cape Verdeans by Unemployment Among Ages 45 to 54 years
In terms of unemployment among ages 45 to 54 years, the demographic groups most similar to Cape Verdeans are Immigrants from St. Vincent and the Grenadines (5.7%, a difference of 0.010%), Yakama (5.7%, a difference of 0.36%), British West Indian (5.7%, a difference of 0.55%), Immigrants from the Azores (5.7%, a difference of 0.87%), and Houma (5.6%, a difference of 1.2%).
| Demographics | Rating | Rank | Unemployment Among Ages 45 to 54 years |
| Immigrants | Grenada | 0.0 /100 | #312 | Tragic 5.6% |
| Shoshone | 0.0 /100 | #313 | Tragic 5.6% |
| Guyanese | 0.0 /100 | #314 | Tragic 5.6% |
| Immigrants | Dominica | 0.0 /100 | #315 | Tragic 5.6% |
| Immigrants | Guyana | 0.0 /100 | #316 | Tragic 5.6% |
| Houma | 0.0 /100 | #317 | Tragic 5.6% |
| British West Indians | 0.0 /100 | #318 | Tragic 5.7% |
| Cape Verdeans | 0.0 /100 | #319 | Tragic 5.7% |
| Immigrants | St. Vincent and the Grenadines | 0.0 /100 | #320 | Tragic 5.7% |
| Yakama | 0.0 /100 | #321 | Tragic 5.7% |
| Immigrants | Azores | 0.0 /100 | #322 | Tragic 5.7% |
| Immigrants | Cabo Verde | 0.0 /100 | #323 | Tragic 5.9% |
| Natives/Alaskans | 0.0 /100 | #324 | Tragic 6.1% |
| Immigrants | Armenia | 0.0 /100 | #325 | Tragic 6.1% |
| Ute | 0.0 /100 | #326 | Tragic 6.2% |