Immigrants from North Macedonia vs Immigrants from Northern Africa Unemployment Among Youth under 25 years
COMPARE
Immigrants from North Macedonia
Immigrants from Northern Africa
Unemployment Among Youth under 25 years
Unemployment Among Youth under 25 years Comparison
Immigrants from North Macedonia
Immigrants from Northern Africa
10.7%
UNEMPLOYMENT AMONG YOUTH UNDER 25 YEARS
100.0/ 100
METRIC RATING
25th/ 347
METRIC RANK
11.5%
UNEMPLOYMENT AMONG YOUTH UNDER 25 YEARS
62.7/ 100
METRIC RATING
162nd/ 347
METRIC RANK
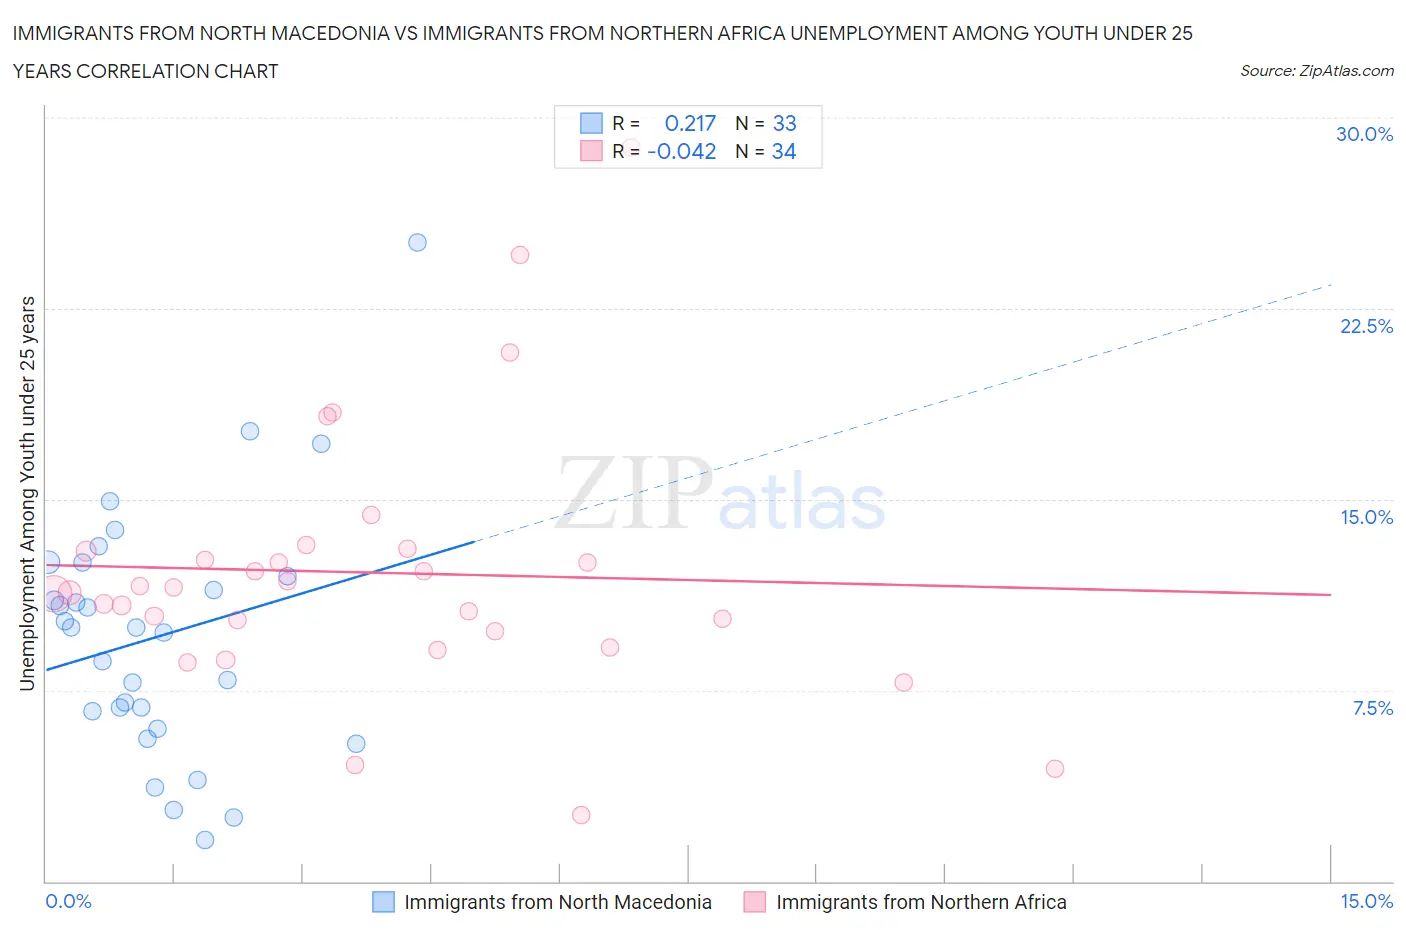
Immigrants from North Macedonia vs Immigrants from Northern Africa Unemployment Among Youth under 25 years Correlation Chart
The statistical analysis conducted on geographies consisting of 74,088,499 people shows a weak positive correlation between the proportion of Immigrants from North Macedonia and unemployment rate among youth under the age of 25 in the United States with a correlation coefficient (R) of 0.217 and weighted average of 10.7%. Similarly, the statistical analysis conducted on geographies consisting of 318,997,087 people shows no correlation between the proportion of Immigrants from Northern Africa and unemployment rate among youth under the age of 25 in the United States with a correlation coefficient (R) of -0.042 and weighted average of 11.5%, a difference of 8.3%.
Unemployment Among Youth under 25 years Correlation Summary
| Measurement | Immigrants from North Macedonia | Immigrants from Northern Africa |
| Minimum | 1.6% | 2.6% |
| Maximum | 25.1% | 28.8% |
| Range | 23.5% | 26.2% |
| Mean | 9.6% | 12.1% |
| Median | 10.0% | 11.4% |
| Interquartile 25% (IQ1) | 6.4% | 9.8% |
| Interquartile 75% (IQ3) | 12.3% | 13.0% |
| Interquartile Range (IQR) | 5.9% | 3.1% |
| Standard Deviation (Sample) | 4.9% | 5.2% |
| Standard Deviation (Population) | 4.8% | 5.1% |
Similar Demographics by Unemployment Among Youth under 25 years
Demographics Similar to Immigrants from North Macedonia by Unemployment Among Youth under 25 years
In terms of unemployment among youth under 25 years, the demographic groups most similar to Immigrants from North Macedonia are Finnish (10.7%, a difference of 0.0%), Immigrants from India (10.7%, a difference of 0.10%), Yugoslavian (10.7%, a difference of 0.11%), Somali (10.7%, a difference of 0.15%), and Immigrants from Bosnia and Herzegovina (10.6%, a difference of 0.24%).
| Demographics | Rating | Rank | Unemployment Among Youth under 25 years |
| Swiss | 100.0 /100 | #18 | Exceptional 10.6% |
| Immigrants | Burma/Myanmar | 100.0 /100 | #19 | Exceptional 10.6% |
| Dutch | 100.0 /100 | #20 | Exceptional 10.6% |
| Pennsylvania Germans | 100.0 /100 | #21 | Exceptional 10.6% |
| Belgians | 100.0 /100 | #22 | Exceptional 10.6% |
| Immigrants | Bosnia and Herzegovina | 100.0 /100 | #23 | Exceptional 10.6% |
| Finns | 100.0 /100 | #24 | Exceptional 10.7% |
| Immigrants | North Macedonia | 100.0 /100 | #25 | Exceptional 10.7% |
| Immigrants | India | 100.0 /100 | #26 | Exceptional 10.7% |
| Yugoslavians | 100.0 /100 | #27 | Exceptional 10.7% |
| Somalis | 100.0 /100 | #28 | Exceptional 10.7% |
| Chinese | 99.9 /100 | #29 | Exceptional 10.7% |
| Osage | 99.9 /100 | #30 | Exceptional 10.7% |
| Slovenes | 99.9 /100 | #31 | Exceptional 10.7% |
| Taiwanese | 99.9 /100 | #32 | Exceptional 10.8% |
Demographics Similar to Immigrants from Northern Africa by Unemployment Among Youth under 25 years
In terms of unemployment among youth under 25 years, the demographic groups most similar to Immigrants from Northern Africa are Immigrants from Kazakhstan (11.5%, a difference of 0.0%), Immigrants from Laos (11.5%, a difference of 0.010%), Immigrants from Sweden (11.5%, a difference of 0.060%), Ukrainian (11.5%, a difference of 0.070%), and Immigrants from Eastern Asia (11.5%, a difference of 0.080%).
| Demographics | Rating | Rank | Unemployment Among Youth under 25 years |
| Immigrants | Romania | 66.3 /100 | #155 | Good 11.5% |
| Immigrants | Germany | 65.9 /100 | #156 | Good 11.5% |
| Indians (Asian) | 65.1 /100 | #157 | Good 11.5% |
| Immigrants | Turkey | 64.8 /100 | #158 | Good 11.5% |
| Immigrants | Western Europe | 64.7 /100 | #159 | Good 11.5% |
| Immigrants | Eastern Asia | 64.5 /100 | #160 | Good 11.5% |
| Ukrainians | 64.3 /100 | #161 | Good 11.5% |
| Immigrants | Northern Africa | 62.7 /100 | #162 | Good 11.5% |
| Immigrants | Kazakhstan | 62.7 /100 | #163 | Good 11.5% |
| Immigrants | Laos | 62.4 /100 | #164 | Good 11.5% |
| Immigrants | Sweden | 61.3 /100 | #165 | Good 11.5% |
| Spanish | 60.3 /100 | #166 | Good 11.6% |
| Okinawans | 58.7 /100 | #167 | Average 11.6% |
| Potawatomi | 57.9 /100 | #168 | Average 11.6% |
| Eastern Europeans | 57.5 /100 | #169 | Average 11.6% |