Immigrants from North Macedonia vs Immigrants from Argentina Unemployment Among Ages 60 to 64 years
COMPARE
Immigrants from North Macedonia
Immigrants from Argentina
Unemployment Among Ages 60 to 64 years
Unemployment Among Ages 60 to 64 years Comparison
Immigrants from North Macedonia
Immigrants from Argentina
5.0%
UNEMPLOYMENT AMONG AGES 60 TO 64 YEARS
1.1/ 100
METRIC RATING
247th/ 347
METRIC RANK
5.1%
UNEMPLOYMENT AMONG AGES 60 TO 64 YEARS
0.2/ 100
METRIC RATING
265th/ 347
METRIC RANK
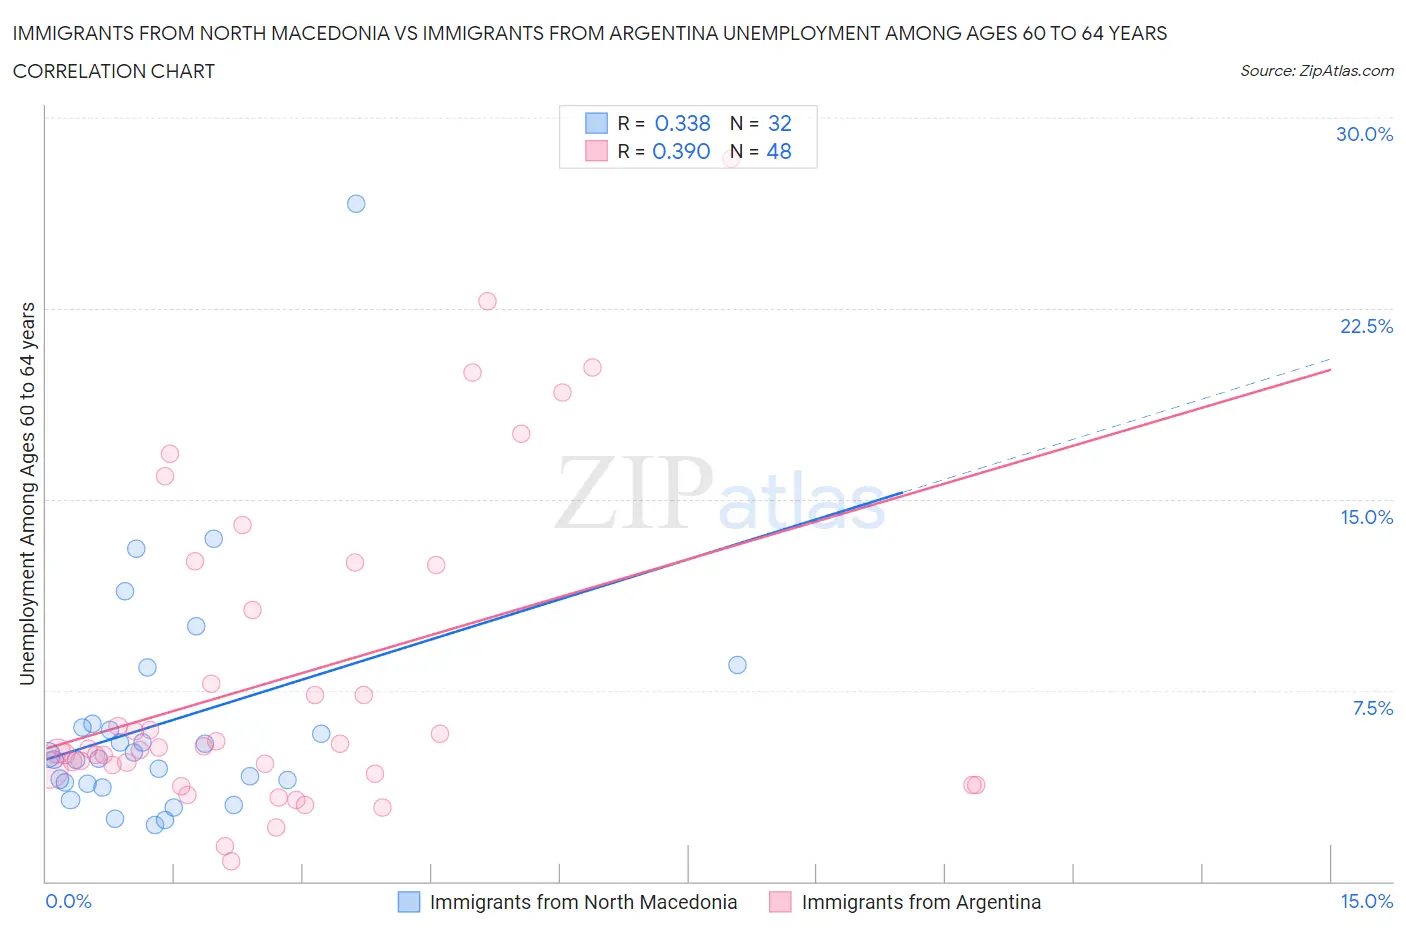
Immigrants from North Macedonia vs Immigrants from Argentina Unemployment Among Ages 60 to 64 years Correlation Chart
The statistical analysis conducted on geographies consisting of 72,412,869 people shows a mild positive correlation between the proportion of Immigrants from North Macedonia and unemployment rate among population between the ages 60 and 64 in the United States with a correlation coefficient (R) of 0.338 and weighted average of 5.0%. Similarly, the statistical analysis conducted on geographies consisting of 250,518,495 people shows a mild positive correlation between the proportion of Immigrants from Argentina and unemployment rate among population between the ages 60 and 64 in the United States with a correlation coefficient (R) of 0.390 and weighted average of 5.1%, a difference of 1.4%.
Unemployment Among Ages 60 to 64 years Correlation Summary
| Measurement | Immigrants from North Macedonia | Immigrants from Argentina |
| Minimum | 2.2% | 0.80% |
| Maximum | 26.6% | 28.4% |
| Range | 24.4% | 27.6% |
| Mean | 6.3% | 8.0% |
| Median | 4.9% | 5.2% |
| Interquartile 25% (IQ1) | 3.9% | 4.3% |
| Interquartile 75% (IQ3) | 6.1% | 11.5% |
| Interquartile Range (IQR) | 2.3% | 7.2% |
| Standard Deviation (Sample) | 4.7% | 6.3% |
| Standard Deviation (Population) | 4.6% | 6.2% |
Demographics Similar to Immigrants from North Macedonia and Immigrants from Argentina by Unemployment Among Ages 60 to 64 years
In terms of unemployment among ages 60 to 64 years, the demographic groups most similar to Immigrants from North Macedonia are Immigrants from South America (5.0%, a difference of 0.0%), Immigrants from Fiji (5.1%, a difference of 0.050%), South American (5.1%, a difference of 0.080%), Immigrants from Cambodia (5.1%, a difference of 0.17%), and Immigrants from Uruguay (5.1%, a difference of 0.20%). Similarly, the demographic groups most similar to Immigrants from Argentina are Immigrants from Australia (5.1%, a difference of 0.020%), Sioux (5.1%, a difference of 0.34%), Immigrants (5.1%, a difference of 0.43%), Immigrants from Uzbekistan (5.1%, a difference of 0.44%), and Immigrants from Ghana (5.1%, a difference of 0.46%).
| Demographics | Rating | Rank | Unemployment Among Ages 60 to 64 years |
| Immigrants | South America | 1.1 /100 | #246 | Tragic 5.0% |
| Immigrants | North Macedonia | 1.1 /100 | #247 | Tragic 5.0% |
| Immigrants | Fiji | 1.1 /100 | #248 | Tragic 5.1% |
| South Americans | 1.0 /100 | #249 | Tragic 5.1% |
| Immigrants | Cambodia | 0.9 /100 | #250 | Tragic 5.1% |
| Immigrants | Uruguay | 0.9 /100 | #251 | Tragic 5.1% |
| Immigrants | Switzerland | 0.9 /100 | #252 | Tragic 5.1% |
| Immigrants | China | 0.9 /100 | #253 | Tragic 5.1% |
| Costa Ricans | 0.8 /100 | #254 | Tragic 5.1% |
| Estonians | 0.8 /100 | #255 | Tragic 5.1% |
| Immigrants | Peru | 0.7 /100 | #256 | Tragic 5.1% |
| Japanese | 0.6 /100 | #257 | Tragic 5.1% |
| Celtics | 0.5 /100 | #258 | Tragic 5.1% |
| Hondurans | 0.5 /100 | #259 | Tragic 5.1% |
| Immigrants | Honduras | 0.4 /100 | #260 | Tragic 5.1% |
| Immigrants | Ghana | 0.4 /100 | #261 | Tragic 5.1% |
| Immigrants | Uzbekistan | 0.4 /100 | #262 | Tragic 5.1% |
| Immigrants | Immigrants | 0.4 /100 | #263 | Tragic 5.1% |
| Sioux | 0.3 /100 | #264 | Tragic 5.1% |
| Immigrants | Argentina | 0.2 /100 | #265 | Tragic 5.1% |
| Immigrants | Australia | 0.2 /100 | #266 | Tragic 5.1% |