Immigrants from North Macedonia vs Hispanic or Latino Unemployment Among Ages 65 to 74 years
COMPARE
Immigrants from North Macedonia
Hispanic or Latino
Unemployment Among Ages 65 to 74 years
Unemployment Among Ages 65 to 74 years Comparison
Immigrants from North Macedonia
Hispanics or Latinos
4.8%
UNEMPLOYMENT AMONG AGES 65 TO 74 YEARS
100.0/ 100
METRIC RATING
15th/ 347
METRIC RANK
5.9%
UNEMPLOYMENT AMONG AGES 65 TO 74 YEARS
0.0/ 100
METRIC RATING
312th/ 347
METRIC RANK
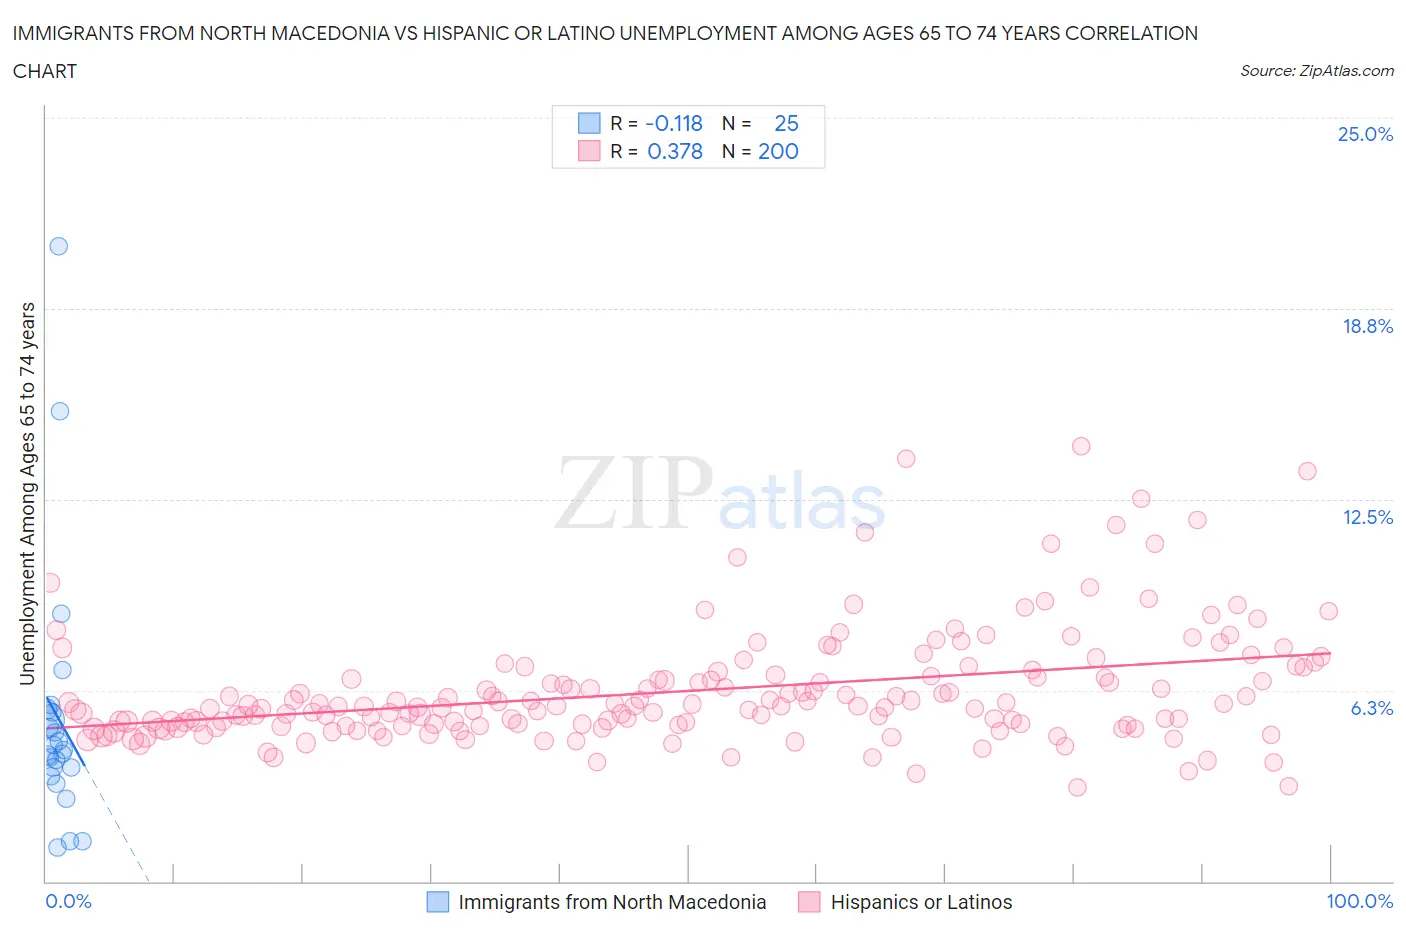
Immigrants from North Macedonia vs Hispanic or Latino Unemployment Among Ages 65 to 74 years Correlation Chart
The statistical analysis conducted on geographies consisting of 71,124,055 people shows a poor negative correlation between the proportion of Immigrants from North Macedonia and unemployment rate among population between the ages 65 and 74 in the United States with a correlation coefficient (R) of -0.118 and weighted average of 4.8%. Similarly, the statistical analysis conducted on geographies consisting of 448,334,304 people shows a mild positive correlation between the proportion of Hispanics or Latinos and unemployment rate among population between the ages 65 and 74 in the United States with a correlation coefficient (R) of 0.378 and weighted average of 5.9%, a difference of 21.8%.
Unemployment Among Ages 65 to 74 years Correlation Summary
| Measurement | Immigrants from North Macedonia | Hispanic or Latino |
| Minimum | 1.1% | 3.1% |
| Maximum | 20.8% | 14.2% |
| Range | 19.7% | 11.2% |
| Mean | 5.4% | 6.2% |
| Median | 4.3% | 5.7% |
| Interquartile 25% (IQ1) | 3.6% | 5.1% |
| Interquartile 75% (IQ3) | 5.6% | 6.7% |
| Interquartile Range (IQR) | 2.0% | 1.6% |
| Standard Deviation (Sample) | 4.3% | 1.9% |
| Standard Deviation (Population) | 4.2% | 1.9% |
Similar Demographics by Unemployment Among Ages 65 to 74 years
Demographics Similar to Immigrants from North Macedonia by Unemployment Among Ages 65 to 74 years
In terms of unemployment among ages 65 to 74 years, the demographic groups most similar to Immigrants from North Macedonia are Immigrants from Burma/Myanmar (4.8%, a difference of 0.29%), Kenyan (4.8%, a difference of 0.31%), Creek (4.8%, a difference of 0.39%), Menominee (4.8%, a difference of 0.43%), and Immigrants from Zaire (4.8%, a difference of 0.69%).
| Demographics | Rating | Rank | Unemployment Among Ages 65 to 74 years |
| Comanche | 100.0 /100 | #8 | Exceptional 4.7% |
| Chickasaw | 100.0 /100 | #9 | Exceptional 4.7% |
| Osage | 100.0 /100 | #10 | Exceptional 4.7% |
| Immigrants | Congo | 100.0 /100 | #11 | Exceptional 4.7% |
| Tongans | 100.0 /100 | #12 | Exceptional 4.7% |
| Lumbee | 100.0 /100 | #13 | Exceptional 4.8% |
| Cubans | 100.0 /100 | #14 | Exceptional 4.8% |
| Immigrants | North Macedonia | 100.0 /100 | #15 | Exceptional 4.8% |
| Immigrants | Burma/Myanmar | 100.0 /100 | #16 | Exceptional 4.8% |
| Kenyans | 100.0 /100 | #17 | Exceptional 4.8% |
| Creek | 100.0 /100 | #18 | Exceptional 4.8% |
| Menominee | 100.0 /100 | #19 | Exceptional 4.8% |
| Immigrants | Zaire | 100.0 /100 | #20 | Exceptional 4.8% |
| Immigrants | Eritrea | 100.0 /100 | #21 | Exceptional 4.9% |
| Lebanese | 100.0 /100 | #22 | Exceptional 4.9% |
Demographics Similar to Hispanics or Latinos by Unemployment Among Ages 65 to 74 years
In terms of unemployment among ages 65 to 74 years, the demographic groups most similar to Hispanics or Latinos are Venezuelan (5.9%, a difference of 0.020%), Immigrants from Bangladesh (5.9%, a difference of 0.060%), Vietnamese (5.9%, a difference of 0.19%), Immigrants from Ecuador (5.8%, a difference of 0.20%), and Guatemalan (5.8%, a difference of 0.24%).
| Demographics | Rating | Rank | Unemployment Among Ages 65 to 74 years |
| Mexicans | 0.0 /100 | #305 | Tragic 5.8% |
| Cheyenne | 0.0 /100 | #306 | Tragic 5.8% |
| British West Indians | 0.0 /100 | #307 | Tragic 5.8% |
| Guatemalans | 0.0 /100 | #308 | Tragic 5.8% |
| Immigrants | Ecuador | 0.0 /100 | #309 | Tragic 5.8% |
| Immigrants | Bangladesh | 0.0 /100 | #310 | Tragic 5.9% |
| Venezuelans | 0.0 /100 | #311 | Tragic 5.9% |
| Hispanics or Latinos | 0.0 /100 | #312 | Tragic 5.9% |
| Vietnamese | 0.0 /100 | #313 | Tragic 5.9% |
| Immigrants | Venezuela | 0.0 /100 | #314 | Tragic 5.9% |
| Immigrants | Guatemala | 0.0 /100 | #315 | Tragic 5.9% |
| Immigrants | El Salvador | 0.0 /100 | #316 | Tragic 5.9% |
| Immigrants | Central America | 0.0 /100 | #317 | Tragic 5.9% |
| Zimbabweans | 0.0 /100 | #318 | Tragic 5.9% |
| Aleuts | 0.0 /100 | #319 | Tragic 5.9% |