Immigrants from North America vs Immigrants from Mexico Unemployment Among Seniors over 75 years
COMPARE
Immigrants from North America
Immigrants from Mexico
Unemployment Among Seniors over 75 years
Unemployment Among Seniors over 75 years Comparison
Immigrants from North America
Immigrants from Mexico
9.2%
UNEMPLOYMENT AMONG SENIORS OVER 75 YEARS
2.4/ 100
METRIC RATING
246th/ 347
METRIC RANK
9.4%
UNEMPLOYMENT AMONG SENIORS OVER 75 YEARS
0.4/ 100
METRIC RATING
267th/ 347
METRIC RANK
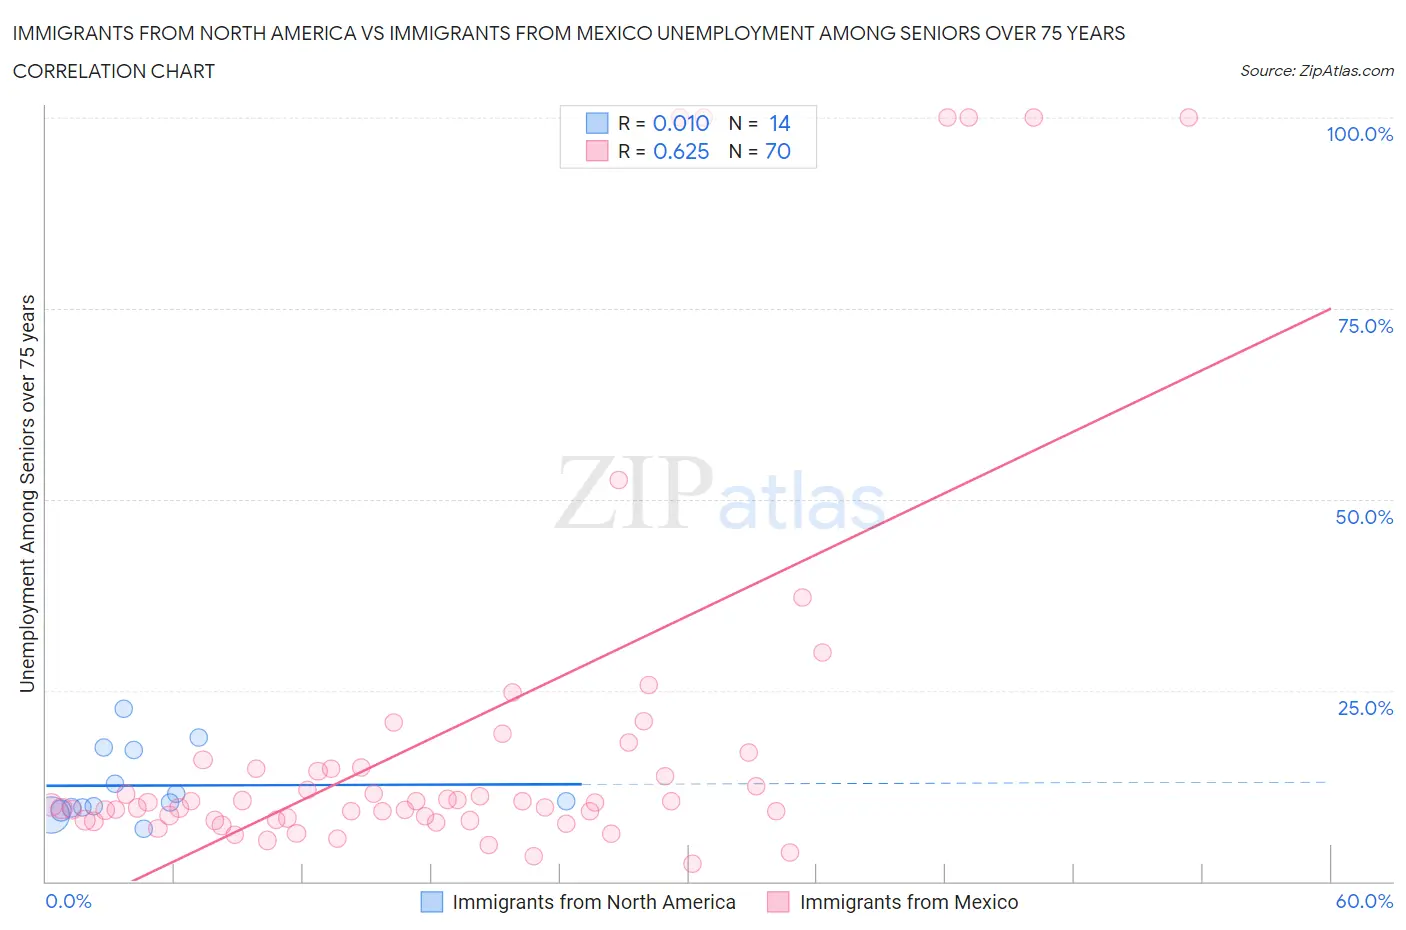
Immigrants from North America vs Immigrants from Mexico Unemployment Among Seniors over 75 years Correlation Chart
The statistical analysis conducted on geographies consisting of 218,247,683 people shows no correlation between the proportion of Immigrants from North America and unemployment rate among seniors over the age of 75 in the United States with a correlation coefficient (R) of 0.010 and weighted average of 9.2%. Similarly, the statistical analysis conducted on geographies consisting of 225,940,289 people shows a significant positive correlation between the proportion of Immigrants from Mexico and unemployment rate among seniors over the age of 75 in the United States with a correlation coefficient (R) of 0.625 and weighted average of 9.4%, a difference of 2.2%.
Unemployment Among Seniors over 75 years Correlation Summary
| Measurement | Immigrants from North America | Immigrants from Mexico |
| Minimum | 6.9% | 2.3% |
| Maximum | 22.6% | 100.0% |
| Range | 15.7% | 97.7% |
| Mean | 12.5% | 19.5% |
| Median | 10.4% | 10.3% |
| Interquartile 25% (IQ1) | 9.7% | 8.1% |
| Interquartile 75% (IQ3) | 17.1% | 14.9% |
| Interquartile Range (IQR) | 7.5% | 6.8% |
| Standard Deviation (Sample) | 4.6% | 26.0% |
| Standard Deviation (Population) | 4.5% | 25.8% |
Similar Demographics by Unemployment Among Seniors over 75 years
Demographics Similar to Immigrants from North America by Unemployment Among Seniors over 75 years
In terms of unemployment among seniors over 75 years, the demographic groups most similar to Immigrants from North America are Subsaharan African (9.2%, a difference of 0.020%), Blackfeet (9.2%, a difference of 0.060%), Immigrants from Saudi Arabia (9.2%, a difference of 0.11%), Immigrants from Canada (9.2%, a difference of 0.12%), and Central American Indian (9.2%, a difference of 0.12%).
| Demographics | Rating | Rank | Unemployment Among Seniors over 75 years |
| Mexicans | 3.5 /100 | #239 | Tragic 9.1% |
| Spanish | 3.3 /100 | #240 | Tragic 9.1% |
| Immigrants | Southern Europe | 2.8 /100 | #241 | Tragic 9.2% |
| Sierra Leoneans | 2.8 /100 | #242 | Tragic 9.2% |
| Slavs | 2.8 /100 | #243 | Tragic 9.2% |
| Immigrants | Germany | 2.7 /100 | #244 | Tragic 9.2% |
| Immigrants | Canada | 2.6 /100 | #245 | Tragic 9.2% |
| Immigrants | North America | 2.4 /100 | #246 | Tragic 9.2% |
| Sub-Saharan Africans | 2.3 /100 | #247 | Tragic 9.2% |
| Blackfeet | 2.3 /100 | #248 | Tragic 9.2% |
| Immigrants | Saudi Arabia | 2.2 /100 | #249 | Tragic 9.2% |
| Central American Indians | 2.2 /100 | #250 | Tragic 9.2% |
| Immigrants | Poland | 2.0 /100 | #251 | Tragic 9.2% |
| Immigrants | Sudan | 2.0 /100 | #252 | Tragic 9.2% |
| Pima | 1.8 /100 | #253 | Tragic 9.2% |
Demographics Similar to Immigrants from Mexico by Unemployment Among Seniors over 75 years
In terms of unemployment among seniors over 75 years, the demographic groups most similar to Immigrants from Mexico are Black/African American (9.4%, a difference of 0.12%), Greek (9.4%, a difference of 0.16%), Puerto Rican (9.4%, a difference of 0.30%), Yaqui (9.4%, a difference of 0.40%), and Palestinian (9.3%, a difference of 0.44%).
| Demographics | Rating | Rank | Unemployment Among Seniors over 75 years |
| Immigrants | Cameroon | 1.0 /100 | #260 | Tragic 9.3% |
| Celtics | 0.8 /100 | #261 | Tragic 9.3% |
| Austrians | 0.7 /100 | #262 | Tragic 9.3% |
| Ukrainians | 0.7 /100 | #263 | Tragic 9.3% |
| Iroquois | 0.7 /100 | #264 | Tragic 9.3% |
| Palestinians | 0.6 /100 | #265 | Tragic 9.3% |
| Blacks/African Americans | 0.5 /100 | #266 | Tragic 9.4% |
| Immigrants | Mexico | 0.4 /100 | #267 | Tragic 9.4% |
| Greeks | 0.4 /100 | #268 | Tragic 9.4% |
| Puerto Ricans | 0.3 /100 | #269 | Tragic 9.4% |
| Yaqui | 0.3 /100 | #270 | Tragic 9.4% |
| Bulgarians | 0.3 /100 | #271 | Tragic 9.4% |
| Immigrants | Iraq | 0.3 /100 | #272 | Tragic 9.4% |
| Czechoslovakians | 0.3 /100 | #273 | Tragic 9.4% |
| Jamaicans | 0.2 /100 | #274 | Tragic 9.5% |