Immigrants from Nigeria vs Mexican Unemployment Among Seniors over 75 years
COMPARE
Immigrants from Nigeria
Mexican
Unemployment Among Seniors over 75 years
Unemployment Among Seniors over 75 years Comparison
Immigrants from Nigeria
Mexicans
9.6%
UNEMPLOYMENT AMONG SENIORS OVER 75 YEARS
0.0/ 100
METRIC RATING
283rd/ 347
METRIC RANK
9.1%
UNEMPLOYMENT AMONG SENIORS OVER 75 YEARS
3.5/ 100
METRIC RATING
239th/ 347
METRIC RANK
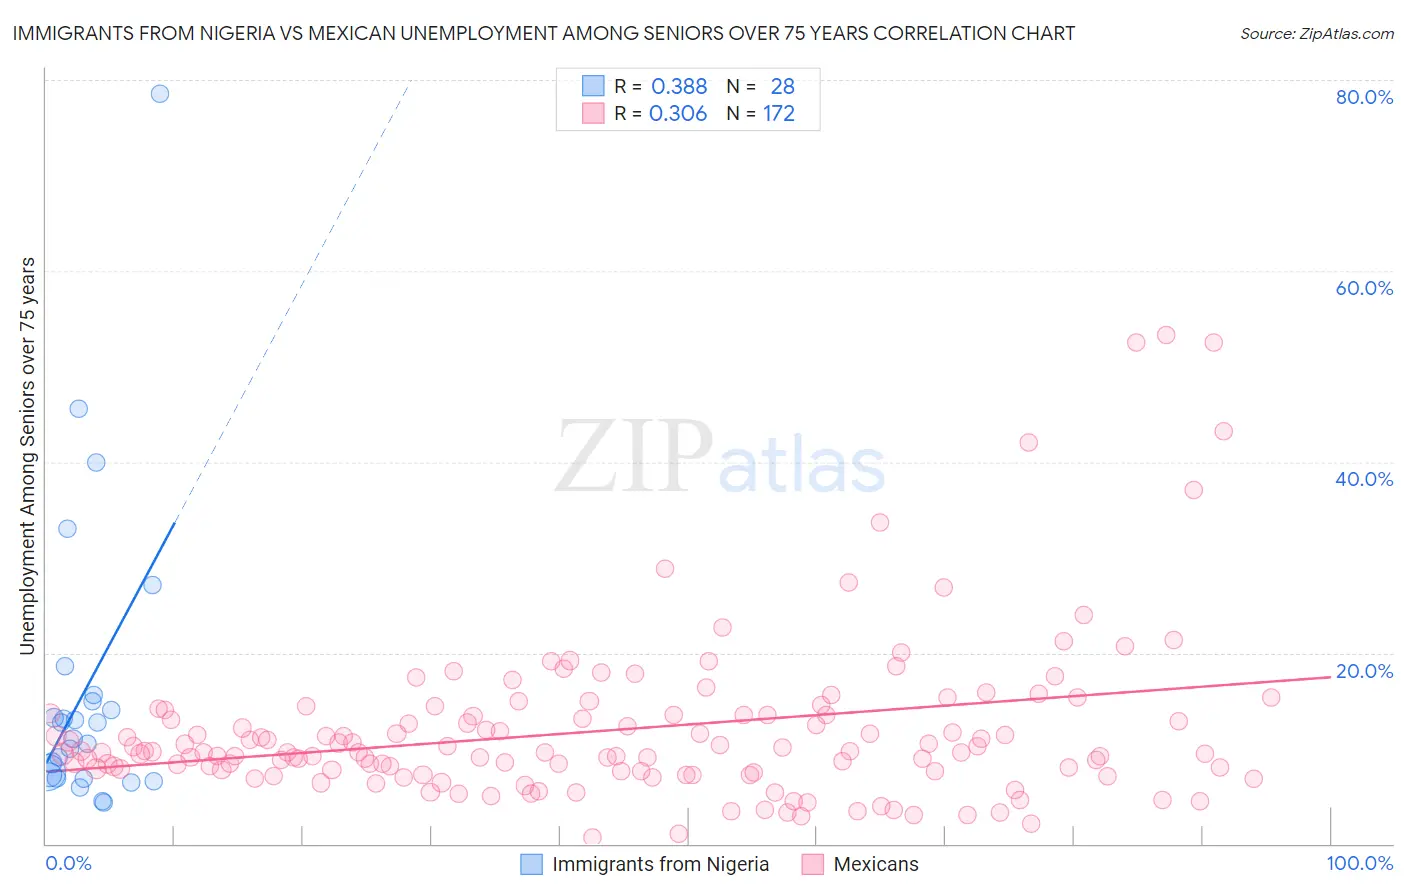
Immigrants from Nigeria vs Mexican Unemployment Among Seniors over 75 years Correlation Chart
The statistical analysis conducted on geographies consisting of 160,553,322 people shows a mild positive correlation between the proportion of Immigrants from Nigeria and unemployment rate among seniors over the age of 75 in the United States with a correlation coefficient (R) of 0.388 and weighted average of 9.6%. Similarly, the statistical analysis conducted on geographies consisting of 234,416,253 people shows a mild positive correlation between the proportion of Mexicans and unemployment rate among seniors over the age of 75 in the United States with a correlation coefficient (R) of 0.306 and weighted average of 9.1%, a difference of 5.5%.
Unemployment Among Seniors over 75 years Correlation Summary
| Measurement | Immigrants from Nigeria | Mexican |
| Minimum | 4.3% | 0.60% |
| Maximum | 78.6% | 53.3% |
| Range | 74.3% | 52.7% |
| Mean | 16.3% | 11.9% |
| Median | 11.8% | 9.6% |
| Interquartile 25% (IQ1) | 7.0% | 7.6% |
| Interquartile 75% (IQ3) | 15.2% | 13.5% |
| Interquartile Range (IQR) | 8.2% | 5.9% |
| Standard Deviation (Sample) | 16.0% | 8.6% |
| Standard Deviation (Population) | 15.7% | 8.5% |
Similar Demographics by Unemployment Among Seniors over 75 years
Demographics Similar to Immigrants from Nigeria by Unemployment Among Seniors over 75 years
In terms of unemployment among seniors over 75 years, the demographic groups most similar to Immigrants from Nigeria are Macedonian (9.6%, a difference of 0.030%), European (9.7%, a difference of 0.21%), Carpatho Rusyn (9.7%, a difference of 0.24%), Nigerian (9.7%, a difference of 0.31%), and Bangladeshi (9.6%, a difference of 0.38%).
| Demographics | Rating | Rank | Unemployment Among Seniors over 75 years |
| Arabs | 0.2 /100 | #276 | Tragic 9.5% |
| Swiss | 0.1 /100 | #277 | Tragic 9.5% |
| Immigrants | Senegal | 0.1 /100 | #278 | Tragic 9.6% |
| British | 0.1 /100 | #279 | Tragic 9.6% |
| Croatians | 0.1 /100 | #280 | Tragic 9.6% |
| Bangladeshis | 0.1 /100 | #281 | Tragic 9.6% |
| Macedonians | 0.0 /100 | #282 | Tragic 9.6% |
| Immigrants | Nigeria | 0.0 /100 | #283 | Tragic 9.6% |
| Europeans | 0.0 /100 | #284 | Tragic 9.7% |
| Carpatho Rusyns | 0.0 /100 | #285 | Tragic 9.7% |
| Nigerians | 0.0 /100 | #286 | Tragic 9.7% |
| Danes | 0.0 /100 | #287 | Tragic 9.7% |
| Canadians | 0.0 /100 | #288 | Tragic 9.7% |
| Czechs | 0.0 /100 | #289 | Tragic 9.7% |
| Sioux | 0.0 /100 | #290 | Tragic 9.7% |
Demographics Similar to Mexicans by Unemployment Among Seniors over 75 years
In terms of unemployment among seniors over 75 years, the demographic groups most similar to Mexicans are Inupiat (9.1%, a difference of 0.050%), Spanish (9.1%, a difference of 0.050%), Houma (9.1%, a difference of 0.15%), Jordanian (9.1%, a difference of 0.19%), and Panamanian (9.1%, a difference of 0.20%).
| Demographics | Rating | Rank | Unemployment Among Seniors over 75 years |
| Africans | 4.9 /100 | #232 | Tragic 9.1% |
| Yugoslavians | 4.8 /100 | #233 | Tragic 9.1% |
| Vietnamese | 4.6 /100 | #234 | Tragic 9.1% |
| Panamanians | 4.0 /100 | #235 | Tragic 9.1% |
| Jordanians | 4.0 /100 | #236 | Tragic 9.1% |
| Houma | 3.9 /100 | #237 | Tragic 9.1% |
| Inupiat | 3.6 /100 | #238 | Tragic 9.1% |
| Mexicans | 3.5 /100 | #239 | Tragic 9.1% |
| Spanish | 3.3 /100 | #240 | Tragic 9.1% |
| Immigrants | Southern Europe | 2.8 /100 | #241 | Tragic 9.2% |
| Sierra Leoneans | 2.8 /100 | #242 | Tragic 9.2% |
| Slavs | 2.8 /100 | #243 | Tragic 9.2% |
| Immigrants | Germany | 2.7 /100 | #244 | Tragic 9.2% |
| Immigrants | Canada | 2.6 /100 | #245 | Tragic 9.2% |
| Immigrants | North America | 2.4 /100 | #246 | Tragic 9.2% |