Immigrants from Nicaragua vs Turkish Unemployment Among Ages 30 to 34 years
COMPARE
Immigrants from Nicaragua
Turkish
Unemployment Among Ages 30 to 34 years
Unemployment Among Ages 30 to 34 years Comparison
Immigrants from Nicaragua
Turks
5.5%
UNEMPLOYMENT AMONG AGES 30 TO 34 YEARS
28.9/ 100
METRIC RATING
197th/ 347
METRIC RANK
5.1%
UNEMPLOYMENT AMONG AGES 30 TO 34 YEARS
98.2/ 100
METRIC RATING
51st/ 347
METRIC RANK
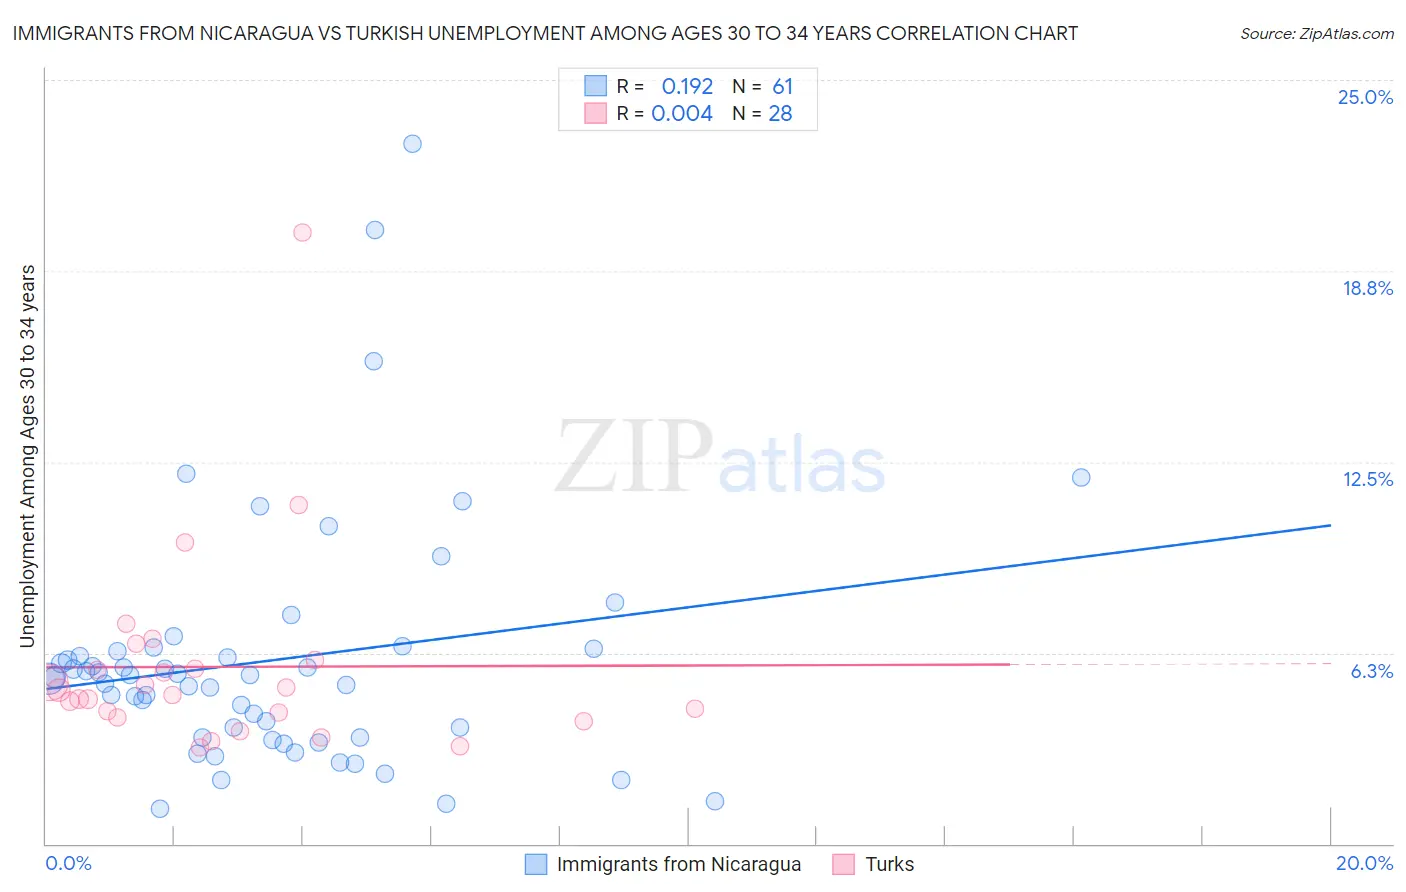
Immigrants from Nicaragua vs Turkish Unemployment Among Ages 30 to 34 years Correlation Chart
The statistical analysis conducted on geographies consisting of 230,193,991 people shows a poor positive correlation between the proportion of Immigrants from Nicaragua and unemployment rate among population between the ages 30 and 34 in the United States with a correlation coefficient (R) of 0.192 and weighted average of 5.5%. Similarly, the statistical analysis conducted on geographies consisting of 260,750,898 people shows no correlation between the proportion of Turks and unemployment rate among population between the ages 30 and 34 in the United States with a correlation coefficient (R) of 0.004 and weighted average of 5.1%, a difference of 9.1%.
Unemployment Among Ages 30 to 34 years Correlation Summary
| Measurement | Immigrants from Nicaragua | Turkish |
| Minimum | 1.1% | 3.2% |
| Maximum | 22.9% | 20.0% |
| Range | 21.8% | 16.8% |
| Mean | 6.0% | 5.8% |
| Median | 5.4% | 4.9% |
| Interquartile 25% (IQ1) | 3.5% | 4.2% |
| Interquartile 75% (IQ3) | 6.3% | 5.9% |
| Interquartile Range (IQR) | 2.9% | 1.6% |
| Standard Deviation (Sample) | 4.0% | 3.3% |
| Standard Deviation (Population) | 4.0% | 3.3% |
Similar Demographics by Unemployment Among Ages 30 to 34 years
Demographics Similar to Immigrants from Nicaragua by Unemployment Among Ages 30 to 34 years
In terms of unemployment among ages 30 to 34 years, the demographic groups most similar to Immigrants from Nicaragua are Immigrants from South America (5.5%, a difference of 0.080%), Immigrants from Afghanistan (5.6%, a difference of 0.14%), Finnish (5.5%, a difference of 0.15%), Slavic (5.5%, a difference of 0.16%), and Immigrants from Africa (5.5%, a difference of 0.18%).
| Demographics | Rating | Rank | Unemployment Among Ages 30 to 34 years |
| Immigrants | Kazakhstan | 33.9 /100 | #190 | Fair 5.5% |
| Irish | 31.3 /100 | #191 | Fair 5.5% |
| Moroccans | 31.2 /100 | #192 | Fair 5.5% |
| Immigrants | Africa | 31.0 /100 | #193 | Fair 5.5% |
| Slavs | 30.9 /100 | #194 | Fair 5.5% |
| Finns | 30.7 /100 | #195 | Fair 5.5% |
| Immigrants | South America | 29.8 /100 | #196 | Fair 5.5% |
| Immigrants | Nicaragua | 28.9 /100 | #197 | Fair 5.5% |
| Immigrants | Afghanistan | 27.2 /100 | #198 | Fair 5.6% |
| Nicaraguans | 26.6 /100 | #199 | Fair 5.6% |
| Immigrants | Southern Europe | 25.8 /100 | #200 | Fair 5.6% |
| South American Indians | 24.4 /100 | #201 | Fair 5.6% |
| Immigrants | Germany | 22.9 /100 | #202 | Fair 5.6% |
| Koreans | 20.7 /100 | #203 | Fair 5.6% |
| Immigrants | Cameroon | 18.4 /100 | #204 | Poor 5.6% |
Demographics Similar to Turks by Unemployment Among Ages 30 to 34 years
In terms of unemployment among ages 30 to 34 years, the demographic groups most similar to Turks are Puget Sound Salish (5.1%, a difference of 0.030%), Immigrants from Burma/Myanmar (5.1%, a difference of 0.040%), Cuban (5.1%, a difference of 0.090%), Immigrants from Malaysia (5.1%, a difference of 0.11%), and Assyrian/Chaldean/Syriac (5.1%, a difference of 0.23%).
| Demographics | Rating | Rank | Unemployment Among Ages 30 to 34 years |
| Immigrants | Belgium | 98.7 /100 | #44 | Exceptional 5.1% |
| Yugoslavians | 98.6 /100 | #45 | Exceptional 5.1% |
| Immigrants | Congo | 98.4 /100 | #46 | Exceptional 5.1% |
| Cypriots | 98.4 /100 | #47 | Exceptional 5.1% |
| Assyrians/Chaldeans/Syriacs | 98.4 /100 | #48 | Exceptional 5.1% |
| Immigrants | Malaysia | 98.3 /100 | #49 | Exceptional 5.1% |
| Puget Sound Salish | 98.2 /100 | #50 | Exceptional 5.1% |
| Turks | 98.2 /100 | #51 | Exceptional 5.1% |
| Immigrants | Burma/Myanmar | 98.1 /100 | #52 | Exceptional 5.1% |
| Cubans | 98.1 /100 | #53 | Exceptional 5.1% |
| Immigrants | Morocco | 97.9 /100 | #54 | Exceptional 5.1% |
| Chinese | 97.7 /100 | #55 | Exceptional 5.1% |
| Immigrants | Serbia | 97.4 /100 | #56 | Exceptional 5.1% |
| Immigrants | China | 97.2 /100 | #57 | Exceptional 5.1% |
| Asians | 97.2 /100 | #58 | Exceptional 5.1% |