Immigrants from Netherlands vs Afghan Unemployment Among Seniors over 65 years
COMPARE
Immigrants from Netherlands
Afghan
Unemployment Among Seniors over 65 years
Unemployment Among Seniors over 65 years Comparison
Immigrants from Netherlands
Afghans
5.0%
UNEMPLOYMENT AMONG SENIORS OVER 65 YEARS
98.8/ 100
METRIC RATING
79th/ 347
METRIC RANK
5.0%
UNEMPLOYMENT AMONG SENIORS OVER 65 YEARS
97.6/ 100
METRIC RATING
88th/ 347
METRIC RANK
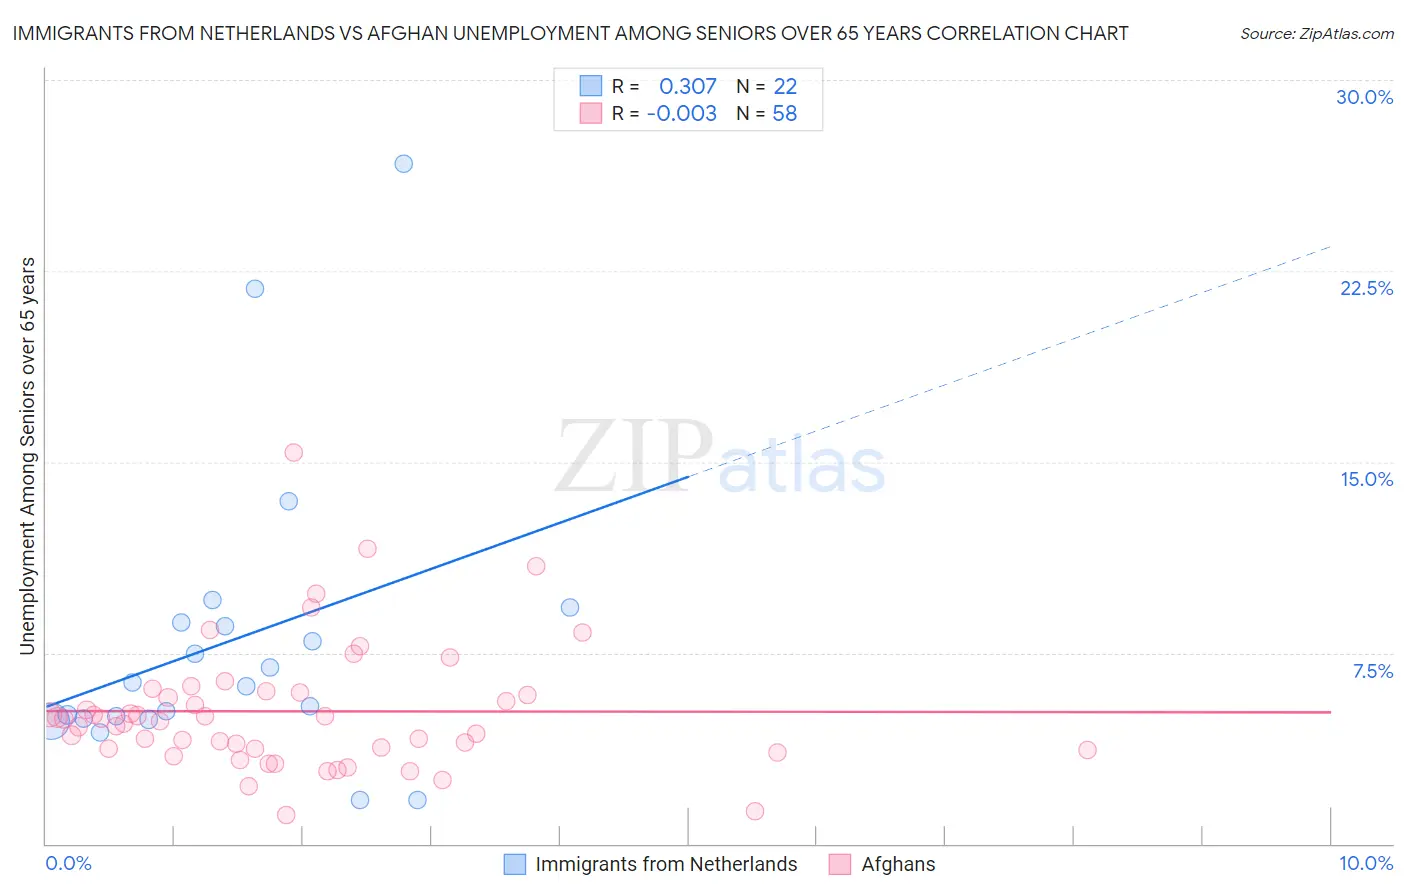
Immigrants from Netherlands vs Afghan Unemployment Among Seniors over 65 years Correlation Chart
The statistical analysis conducted on geographies consisting of 223,089,911 people shows a mild positive correlation between the proportion of Immigrants from Netherlands and unemployment rate amomg seniors over the age of 65 in the United States with a correlation coefficient (R) of 0.307 and weighted average of 5.0%. Similarly, the statistical analysis conducted on geographies consisting of 143,655,146 people shows no correlation between the proportion of Afghans and unemployment rate amomg seniors over the age of 65 in the United States with a correlation coefficient (R) of -0.003 and weighted average of 5.0%, a difference of 0.56%.
Unemployment Among Seniors over 65 years Correlation Summary
| Measurement | Immigrants from Netherlands | Afghan |
| Minimum | 1.7% | 1.1% |
| Maximum | 26.7% | 15.3% |
| Range | 25.0% | 14.2% |
| Mean | 8.0% | 5.2% |
| Median | 6.3% | 4.9% |
| Interquartile 25% (IQ1) | 4.9% | 3.7% |
| Interquartile 75% (IQ3) | 8.7% | 5.9% |
| Interquartile Range (IQR) | 3.8% | 2.2% |
| Standard Deviation (Sample) | 5.9% | 2.5% |
| Standard Deviation (Population) | 5.8% | 2.5% |
Demographics Similar to Immigrants from Netherlands and Afghans by Unemployment Among Seniors over 65 years
In terms of unemployment among seniors over 65 years, the demographic groups most similar to Immigrants from Netherlands are Slavic (5.0%, a difference of 0.050%), Immigrants from Ethiopia (5.0%, a difference of 0.10%), Estonian (5.0%, a difference of 0.19%), Serbian (5.0%, a difference of 0.22%), and Thai (5.0%, a difference of 0.24%). Similarly, the demographic groups most similar to Afghans are Immigrants from South Central Asia (5.0%, a difference of 0.010%), Immigrants from South Africa (5.0%, a difference of 0.020%), Immigrants from Bolivia (5.0%, a difference of 0.10%), Immigrants from Bulgaria (5.0%, a difference of 0.12%), and Austrian (5.0%, a difference of 0.12%).
| Demographics | Rating | Rank | Unemployment Among Seniors over 65 years |
| Immigrants | Japan | 99.2 /100 | #73 | Exceptional 4.9% |
| Japanese | 99.2 /100 | #74 | Exceptional 4.9% |
| British | 99.1 /100 | #75 | Exceptional 4.9% |
| Welsh | 99.1 /100 | #76 | Exceptional 5.0% |
| Thais | 99.1 /100 | #77 | Exceptional 5.0% |
| Slavs | 98.9 /100 | #78 | Exceptional 5.0% |
| Immigrants | Netherlands | 98.8 /100 | #79 | Exceptional 5.0% |
| Immigrants | Ethiopia | 98.6 /100 | #80 | Exceptional 5.0% |
| Estonians | 98.5 /100 | #81 | Exceptional 5.0% |
| Serbians | 98.4 /100 | #82 | Exceptional 5.0% |
| Immigrants | Zimbabwe | 98.3 /100 | #83 | Exceptional 5.0% |
| Filipinos | 98.3 /100 | #84 | Exceptional 5.0% |
| Immigrants | Hungary | 98.2 /100 | #85 | Exceptional 5.0% |
| Immigrants | Taiwan | 98.2 /100 | #86 | Exceptional 5.0% |
| Immigrants | Switzerland | 98.2 /100 | #87 | Exceptional 5.0% |
| Afghans | 97.6 /100 | #88 | Exceptional 5.0% |
| Immigrants | South Central Asia | 97.6 /100 | #89 | Exceptional 5.0% |
| Immigrants | South Africa | 97.6 /100 | #90 | Exceptional 5.0% |
| Immigrants | Bolivia | 97.3 /100 | #91 | Exceptional 5.0% |
| Immigrants | Bulgaria | 97.3 /100 | #92 | Exceptional 5.0% |
| Austrians | 97.3 /100 | #93 | Exceptional 5.0% |