Immigrants from Morocco vs Slavic Unemployment Among Ages 20 to 24 years
COMPARE
Immigrants from Morocco
Slavic
Unemployment Among Ages 20 to 24 years
Unemployment Among Ages 20 to 24 years Comparison
Immigrants from Morocco
Slavs
10.1%
UNEMPLOYMENT AMONG AGES 20 TO 24 YEARS
90.5/ 100
METRIC RATING
115th/ 347
METRIC RANK
10.0%
UNEMPLOYMENT AMONG AGES 20 TO 24 YEARS
96.1/ 100
METRIC RATING
97th/ 347
METRIC RANK
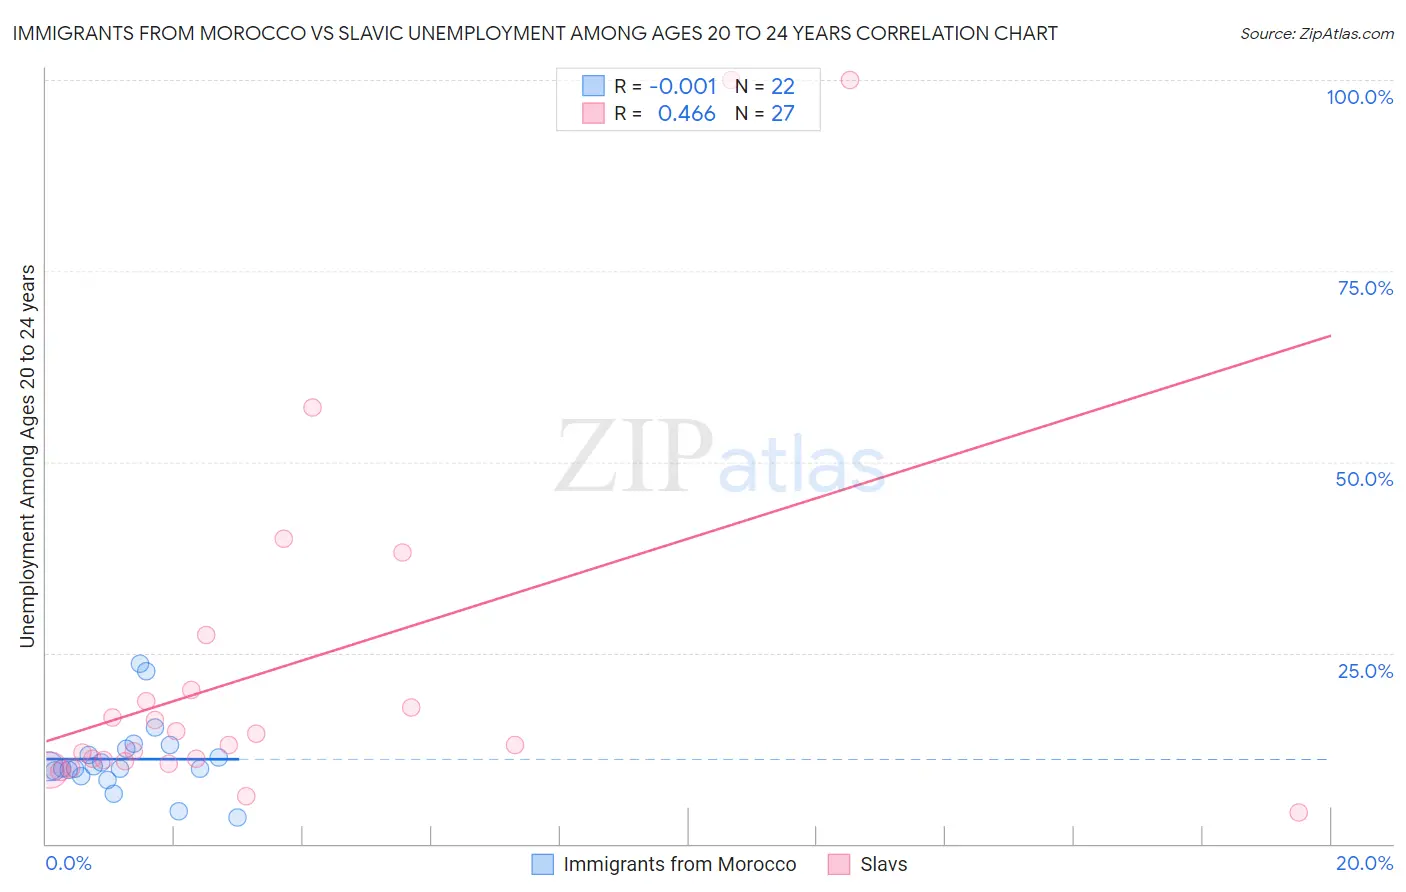
Immigrants from Morocco vs Slavic Unemployment Among Ages 20 to 24 years Correlation Chart
The statistical analysis conducted on geographies consisting of 177,201,204 people shows no correlation between the proportion of Immigrants from Morocco and unemployment rate among population between the ages 20 and 24 in the United States with a correlation coefficient (R) of -0.001 and weighted average of 10.1%. Similarly, the statistical analysis conducted on geographies consisting of 263,648,078 people shows a moderate positive correlation between the proportion of Slavs and unemployment rate among population between the ages 20 and 24 in the United States with a correlation coefficient (R) of 0.466 and weighted average of 10.0%, a difference of 0.89%.
Unemployment Among Ages 20 to 24 years Correlation Summary
| Measurement | Immigrants from Morocco | Slavic |
| Minimum | 3.5% | 4.1% |
| Maximum | 23.5% | 100.0% |
| Range | 20.0% | 95.9% |
| Mean | 11.1% | 23.1% |
| Median | 10.0% | 13.0% |
| Interquartile 25% (IQ1) | 9.5% | 10.8% |
| Interquartile 75% (IQ3) | 12.5% | 20.2% |
| Interquartile Range (IQR) | 3.0% | 9.4% |
| Standard Deviation (Sample) | 4.7% | 24.9% |
| Standard Deviation (Population) | 4.6% | 24.5% |
Demographics Similar to Immigrants from Morocco and Slavs by Unemployment Among Ages 20 to 24 years
In terms of unemployment among ages 20 to 24 years, the demographic groups most similar to Immigrants from Morocco are Ottawa (10.1%, a difference of 0.040%), Basque (10.1%, a difference of 0.070%), German Russian (10.1%, a difference of 0.24%), Northern European (10.1%, a difference of 0.27%), and Immigrants from Indonesia (10.1%, a difference of 0.28%). Similarly, the demographic groups most similar to Slavs are Thai (10.0%, a difference of 0.040%), Japanese (10.0%, a difference of 0.16%), Fijian (10.0%, a difference of 0.17%), Immigrants from France (10.0%, a difference of 0.18%), and Laotian (10.0%, a difference of 0.21%).
| Demographics | Rating | Rank | Unemployment Among Ages 20 to 24 years |
| Thais | 96.2 /100 | #96 | Exceptional 10.0% |
| Slavs | 96.1 /100 | #97 | Exceptional 10.0% |
| Japanese | 95.4 /100 | #98 | Exceptional 10.0% |
| Fijians | 95.3 /100 | #99 | Exceptional 10.0% |
| Immigrants | France | 95.2 /100 | #100 | Exceptional 10.0% |
| Laotians | 95.1 /100 | #101 | Exceptional 10.0% |
| Immigrants | Argentina | 94.9 /100 | #102 | Exceptional 10.0% |
| Irish | 94.3 /100 | #103 | Exceptional 10.0% |
| Immigrants | Chile | 94.0 /100 | #104 | Exceptional 10.0% |
| Immigrants | Hungary | 94.0 /100 | #105 | Exceptional 10.0% |
| Pennsylvania Germans | 93.9 /100 | #106 | Exceptional 10.0% |
| Iroquois | 93.4 /100 | #107 | Exceptional 10.1% |
| Immigrants | Latvia | 93.2 /100 | #108 | Exceptional 10.1% |
| Filipinos | 93.2 /100 | #109 | Exceptional 10.1% |
| Immigrants | Spain | 93.1 /100 | #110 | Exceptional 10.1% |
| Immigrants | Indonesia | 92.7 /100 | #111 | Exceptional 10.1% |
| Northern Europeans | 92.7 /100 | #112 | Exceptional 10.1% |
| German Russians | 92.4 /100 | #113 | Exceptional 10.1% |
| Ottawa | 90.8 /100 | #114 | Exceptional 10.1% |
| Immigrants | Morocco | 90.5 /100 | #115 | Exceptional 10.1% |
| Basques | 89.8 /100 | #116 | Excellent 10.1% |