Immigrants from Morocco vs Native/Alaskan Unemployment Among Youth under 25 years
COMPARE
Immigrants from Morocco
Native/Alaskan
Unemployment Among Youth under 25 years
Unemployment Among Youth under 25 years Comparison
Immigrants from Morocco
Natives/Alaskans
11.6%
UNEMPLOYMENT AMONG YOUTH UNDER 25 YEARS
55.1/ 100
METRIC RATING
172nd/ 347
METRIC RANK
14.5%
UNEMPLOYMENT AMONG YOUTH UNDER 25 YEARS
0.0/ 100
METRIC RATING
316th/ 347
METRIC RANK
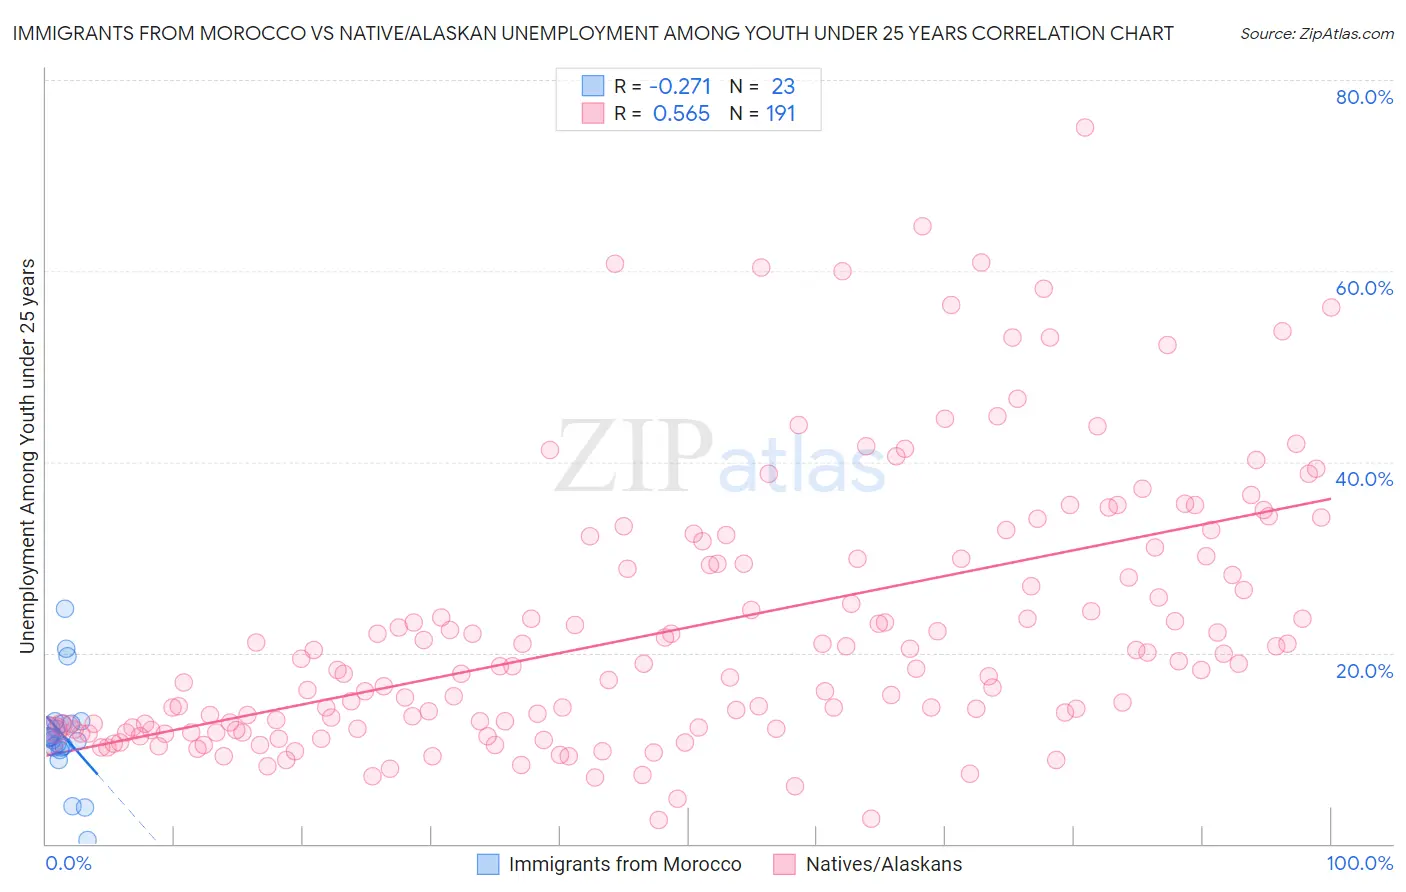
Immigrants from Morocco vs Native/Alaskan Unemployment Among Youth under 25 years Correlation Chart
The statistical analysis conducted on geographies consisting of 178,221,881 people shows a weak negative correlation between the proportion of Immigrants from Morocco and unemployment rate among youth under the age of 25 in the United States with a correlation coefficient (R) of -0.271 and weighted average of 11.6%. Similarly, the statistical analysis conducted on geographies consisting of 499,955,356 people shows a substantial positive correlation between the proportion of Natives/Alaskans and unemployment rate among youth under the age of 25 in the United States with a correlation coefficient (R) of 0.565 and weighted average of 14.5%, a difference of 24.9%.
Unemployment Among Youth under 25 years Correlation Summary
| Measurement | Immigrants from Morocco | Native/Alaskan |
| Minimum | 0.40% | 2.4% |
| Maximum | 24.6% | 75.0% |
| Range | 24.2% | 72.6% |
| Mean | 11.4% | 22.6% |
| Median | 11.1% | 18.5% |
| Interquartile 25% (IQ1) | 10.1% | 12.0% |
| Interquartile 75% (IQ3) | 12.6% | 29.9% |
| Interquartile Range (IQR) | 2.5% | 17.9% |
| Standard Deviation (Sample) | 5.1% | 14.0% |
| Standard Deviation (Population) | 5.0% | 14.0% |
Similar Demographics by Unemployment Among Youth under 25 years
Demographics Similar to Immigrants from Morocco by Unemployment Among Youth under 25 years
In terms of unemployment among youth under 25 years, the demographic groups most similar to Immigrants from Morocco are Bangladeshi (11.6%, a difference of 0.020%), Russian (11.6%, a difference of 0.090%), Eastern European (11.6%, a difference of 0.10%), Potawatomi (11.6%, a difference of 0.12%), and Immigrants from South Eastern Asia (11.6%, a difference of 0.14%).
| Demographics | Rating | Rank | Unemployment Among Youth under 25 years |
| Immigrants | Sweden | 61.3 /100 | #165 | Good 11.5% |
| Spanish | 60.3 /100 | #166 | Good 11.6% |
| Okinawans | 58.7 /100 | #167 | Average 11.6% |
| Potawatomi | 57.9 /100 | #168 | Average 11.6% |
| Eastern Europeans | 57.5 /100 | #169 | Average 11.6% |
| Russians | 57.3 /100 | #170 | Average 11.6% |
| Bangladeshis | 55.6 /100 | #171 | Average 11.6% |
| Immigrants | Morocco | 55.1 /100 | #172 | Average 11.6% |
| Immigrants | South Eastern Asia | 51.7 /100 | #173 | Average 11.6% |
| Immigrants | China | 50.0 /100 | #174 | Average 11.6% |
| Immigrants | Iraq | 47.0 /100 | #175 | Average 11.6% |
| Ugandans | 45.6 /100 | #176 | Average 11.6% |
| Immigrants | Denmark | 45.0 /100 | #177 | Average 11.6% |
| Immigrants | Europe | 42.4 /100 | #178 | Average 11.6% |
| Immigrants | Hong Kong | 42.4 /100 | #179 | Average 11.6% |
Demographics Similar to Natives/Alaskans by Unemployment Among Youth under 25 years
In terms of unemployment among youth under 25 years, the demographic groups most similar to Natives/Alaskans are Black/African American (14.5%, a difference of 0.090%), Sioux (14.4%, a difference of 0.42%), Jamaican (14.4%, a difference of 0.54%), Immigrants from Armenia (14.4%, a difference of 0.63%), and Immigrants from Dominica (14.6%, a difference of 0.80%).
| Demographics | Rating | Rank | Unemployment Among Youth under 25 years |
| Aleuts | 0.0 /100 | #309 | Tragic 14.1% |
| Immigrants | West Indies | 0.0 /100 | #310 | Tragic 14.2% |
| Immigrants | Bangladesh | 0.0 /100 | #311 | Tragic 14.2% |
| Vietnamese | 0.0 /100 | #312 | Tragic 14.3% |
| Immigrants | Armenia | 0.0 /100 | #313 | Tragic 14.4% |
| Jamaicans | 0.0 /100 | #314 | Tragic 14.4% |
| Sioux | 0.0 /100 | #315 | Tragic 14.4% |
| Natives/Alaskans | 0.0 /100 | #316 | Tragic 14.5% |
| Blacks/African Americans | 0.0 /100 | #317 | Tragic 14.5% |
| Immigrants | Dominica | 0.0 /100 | #318 | Tragic 14.6% |
| West Indians | 0.0 /100 | #319 | Tragic 14.6% |
| Barbadians | 0.0 /100 | #320 | Tragic 14.6% |
| Cheyenne | 0.0 /100 | #321 | Tragic 14.6% |
| Trinidadians and Tobagonians | 0.0 /100 | #322 | Tragic 14.6% |
| Immigrants | Trinidad and Tobago | 0.0 /100 | #323 | Tragic 14.6% |