Immigrants from Morocco vs Immigrants from China Male Unemployment
COMPARE
Immigrants from Morocco
Immigrants from China
Male Unemployment
Male Unemployment Comparison
Immigrants from Morocco
Immigrants from China
5.3%
MALE UNEMPLOYMENT
60.2/ 100
METRIC RATING
166th/ 347
METRIC RANK
5.2%
MALE UNEMPLOYMENT
70.6/ 100
METRIC RATING
161st/ 347
METRIC RANK
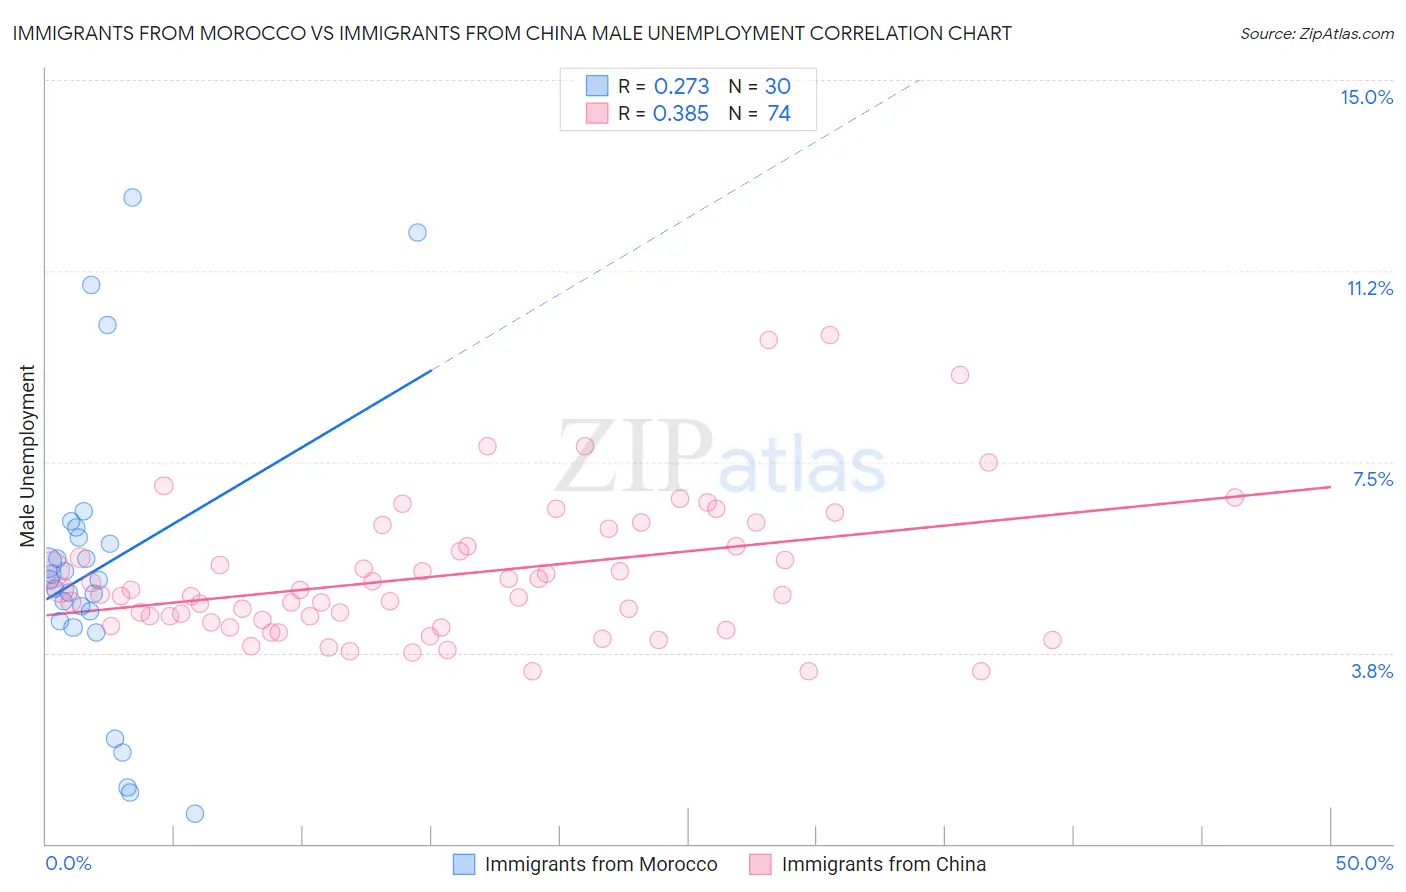
Immigrants from Morocco vs Immigrants from China Male Unemployment Correlation Chart
The statistical analysis conducted on geographies consisting of 178,783,560 people shows a weak positive correlation between the proportion of Immigrants from Morocco and unemployment rate among males in the United States with a correlation coefficient (R) of 0.273 and weighted average of 5.3%. Similarly, the statistical analysis conducted on geographies consisting of 454,688,998 people shows a mild positive correlation between the proportion of Immigrants from China and unemployment rate among males in the United States with a correlation coefficient (R) of 0.385 and weighted average of 5.2%, a difference of 0.69%.
Male Unemployment Correlation Summary
| Measurement | Immigrants from Morocco | Immigrants from China |
| Minimum | 0.60% | 3.4% |
| Maximum | 12.7% | 10.0% |
| Range | 12.1% | 6.6% |
| Mean | 5.4% | 5.3% |
| Median | 5.2% | 4.9% |
| Interquartile 25% (IQ1) | 4.4% | 4.3% |
| Interquartile 75% (IQ3) | 6.0% | 5.9% |
| Interquartile Range (IQR) | 1.6% | 1.5% |
| Standard Deviation (Sample) | 2.9% | 1.4% |
| Standard Deviation (Population) | 2.9% | 1.4% |
Demographics Similar to Immigrants from Morocco and Immigrants from China by Male Unemployment
In terms of male unemployment, the demographic groups most similar to Immigrants from Morocco are South American (5.3%, a difference of 0.030%), Afghan (5.3%, a difference of 0.11%), Immigrants from Vietnam (5.3%, a difference of 0.12%), Immigrants from Ireland (5.3%, a difference of 0.15%), and Immigrants from Congo (5.3%, a difference of 0.17%). Similarly, the demographic groups most similar to Immigrants from China are Immigrants from Norway (5.2%, a difference of 0.030%), Indonesian (5.2%, a difference of 0.040%), Immigrants from Indonesia (5.2%, a difference of 0.070%), Immigrants from Northern Africa (5.2%, a difference of 0.12%), and American (5.2%, a difference of 0.15%).
| Demographics | Rating | Rank | Male Unemployment |
| Immigrants | Uruguay | 73.9 /100 | #153 | Good 5.2% |
| Laotians | 73.8 /100 | #154 | Good 5.2% |
| Immigrants | Hungary | 73.4 /100 | #155 | Good 5.2% |
| Americans | 72.7 /100 | #156 | Good 5.2% |
| Immigrants | Northern Africa | 72.3 /100 | #157 | Good 5.2% |
| Immigrants | Indonesia | 71.5 /100 | #158 | Good 5.2% |
| Indonesians | 71.2 /100 | #159 | Good 5.2% |
| Immigrants | Norway | 71.0 /100 | #160 | Good 5.2% |
| Immigrants | China | 70.6 /100 | #161 | Good 5.2% |
| Immigrants | Egypt | 65.9 /100 | #162 | Good 5.2% |
| Immigrants | Hong Kong | 65.7 /100 | #163 | Good 5.2% |
| Afghans | 62.0 /100 | #164 | Good 5.3% |
| South Americans | 60.6 /100 | #165 | Good 5.3% |
| Immigrants | Morocco | 60.2 /100 | #166 | Good 5.3% |
| Immigrants | Vietnam | 58.1 /100 | #167 | Average 5.3% |
| Immigrants | Ireland | 57.7 /100 | #168 | Average 5.3% |
| Immigrants | Congo | 57.4 /100 | #169 | Average 5.3% |
| Immigrants | Eastern Europe | 54.1 /100 | #170 | Average 5.3% |
| Peruvians | 51.9 /100 | #171 | Average 5.3% |
| Immigrants | Kazakhstan | 50.8 /100 | #172 | Average 5.3% |
| Immigrants | Russia | 50.7 /100 | #173 | Average 5.3% |