Immigrants from Middle Africa vs Scandinavian Unemployment Among Ages 65 to 74 years
COMPARE
Immigrants from Middle Africa
Scandinavian
Unemployment Among Ages 65 to 74 years
Unemployment Among Ages 65 to 74 years Comparison
Immigrants from Middle Africa
Scandinavians
5.2%
UNEMPLOYMENT AMONG AGES 65 TO 74 YEARS
98.4/ 100
METRIC RATING
83rd/ 347
METRIC RANK
5.2%
UNEMPLOYMENT AMONG AGES 65 TO 74 YEARS
99.1/ 100
METRIC RATING
69th/ 347
METRIC RANK
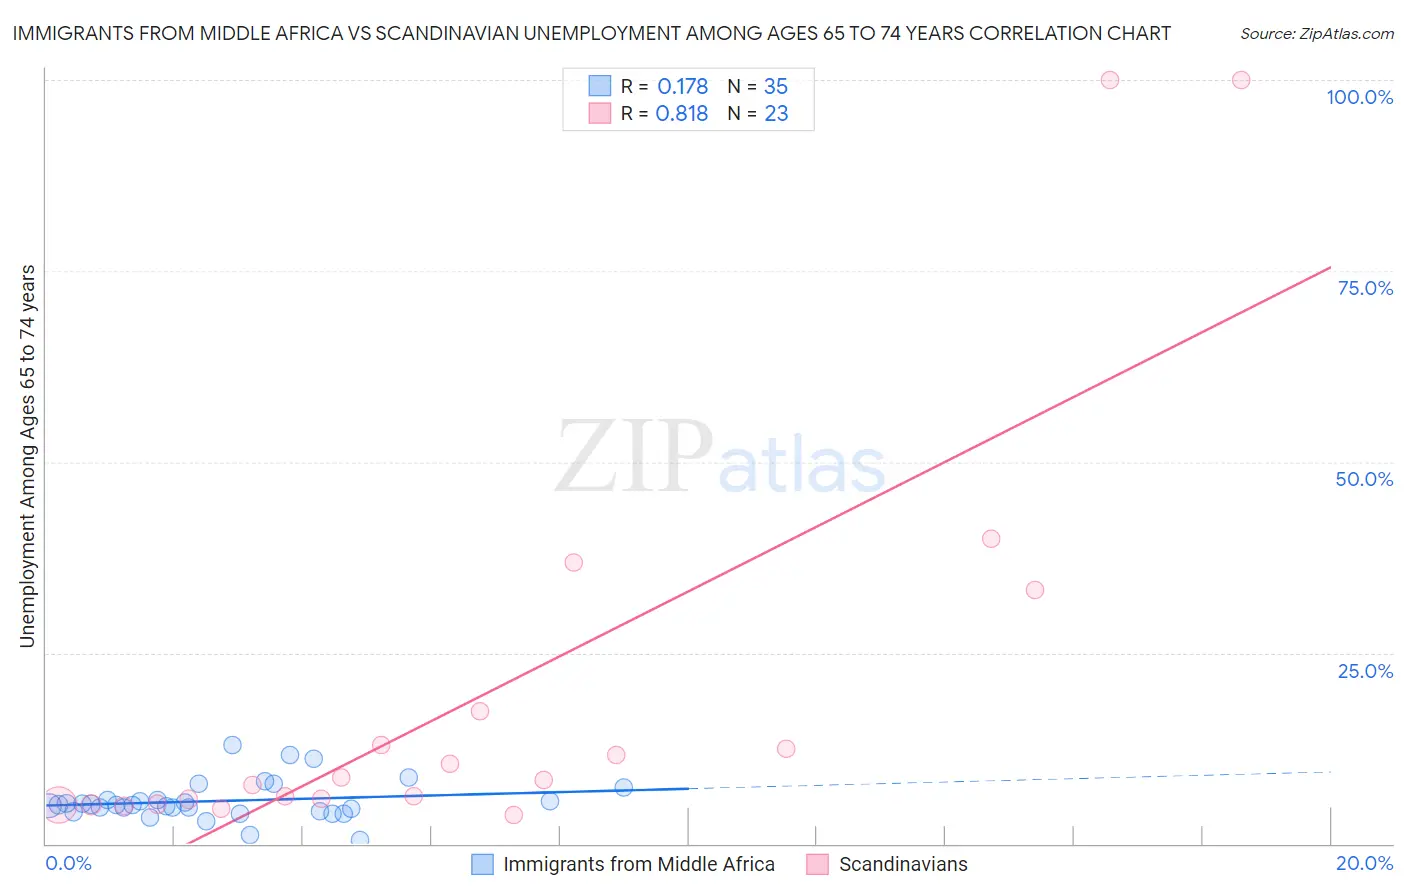
Immigrants from Middle Africa vs Scandinavian Unemployment Among Ages 65 to 74 years Correlation Chart
The statistical analysis conducted on geographies consisting of 188,257,583 people shows a poor positive correlation between the proportion of Immigrants from Middle Africa and unemployment rate among population between the ages 65 and 74 in the United States with a correlation coefficient (R) of 0.178 and weighted average of 5.2%. Similarly, the statistical analysis conducted on geographies consisting of 389,647,988 people shows a very strong positive correlation between the proportion of Scandinavians and unemployment rate among population between the ages 65 and 74 in the United States with a correlation coefficient (R) of 0.818 and weighted average of 5.2%, a difference of 0.57%.
Unemployment Among Ages 65 to 74 years Correlation Summary
| Measurement | Immigrants from Middle Africa | Scandinavian |
| Minimum | 0.50% | 3.8% |
| Maximum | 12.9% | 100.0% |
| Range | 12.4% | 96.2% |
| Mean | 5.6% | 19.7% |
| Median | 5.1% | 8.4% |
| Interquartile 25% (IQ1) | 4.3% | 5.2% |
| Interquartile 75% (IQ3) | 5.8% | 17.3% |
| Interquartile Range (IQR) | 1.4% | 12.2% |
| Standard Deviation (Sample) | 2.6% | 27.4% |
| Standard Deviation (Population) | 2.5% | 26.8% |
Demographics Similar to Immigrants from Middle Africa and Scandinavians by Unemployment Among Ages 65 to 74 years
In terms of unemployment among ages 65 to 74 years, the demographic groups most similar to Immigrants from Middle Africa are Immigrants from Scotland (5.2%, a difference of 0.15%), Thai (5.2%, a difference of 0.15%), Immigrants from South Africa (5.2%, a difference of 0.17%), Immigrants from Hungary (5.2%, a difference of 0.17%), and Slavic (5.2%, a difference of 0.18%). Similarly, the demographic groups most similar to Scandinavians are Immigrants from Japan (5.2%, a difference of 0.010%), Swiss (5.1%, a difference of 0.070%), Latvian (5.1%, a difference of 0.070%), Iroquois (5.1%, a difference of 0.12%), and Scotch-Irish (5.2%, a difference of 0.13%).
| Demographics | Rating | Rank | Unemployment Among Ages 65 to 74 years |
| Iroquois | 99.3 /100 | #66 | Exceptional 5.1% |
| Swiss | 99.2 /100 | #67 | Exceptional 5.1% |
| Latvians | 99.2 /100 | #68 | Exceptional 5.1% |
| Scandinavians | 99.1 /100 | #69 | Exceptional 5.2% |
| Immigrants | Japan | 99.1 /100 | #70 | Exceptional 5.2% |
| Scotch-Irish | 99.0 /100 | #71 | Exceptional 5.2% |
| Immigrants | Oceania | 99.0 /100 | #72 | Exceptional 5.2% |
| Filipinos | 99.0 /100 | #73 | Exceptional 5.2% |
| Afghans | 99.0 /100 | #74 | Exceptional 5.2% |
| Okinawans | 99.0 /100 | #75 | Exceptional 5.2% |
| Estonians | 99.0 /100 | #76 | Exceptional 5.2% |
| Immigrants | Sudan | 98.9 /100 | #77 | Exceptional 5.2% |
| Northern Europeans | 98.9 /100 | #78 | Exceptional 5.2% |
| Slavs | 98.7 /100 | #79 | Exceptional 5.2% |
| Immigrants | South Africa | 98.6 /100 | #80 | Exceptional 5.2% |
| Immigrants | Scotland | 98.6 /100 | #81 | Exceptional 5.2% |
| Thais | 98.6 /100 | #82 | Exceptional 5.2% |
| Immigrants | Middle Africa | 98.4 /100 | #83 | Exceptional 5.2% |
| Immigrants | Hungary | 98.0 /100 | #84 | Exceptional 5.2% |
| British | 97.9 /100 | #85 | Exceptional 5.2% |
| Danes | 97.9 /100 | #86 | Exceptional 5.2% |