Immigrants from Middle Africa vs Samoan Unemployment Among Seniors over 65 years
COMPARE
Immigrants from Middle Africa
Samoan
Unemployment Among Seniors over 65 years
Unemployment Among Seniors over 65 years Comparison
Immigrants from Middle Africa
Samoans
4.9%
UNEMPLOYMENT AMONG SENIORS OVER 65 YEARS
99.7/ 100
METRIC RATING
60th/ 347
METRIC RANK
5.3%
UNEMPLOYMENT AMONG SENIORS OVER 65 YEARS
4.2/ 100
METRIC RATING
229th/ 347
METRIC RANK
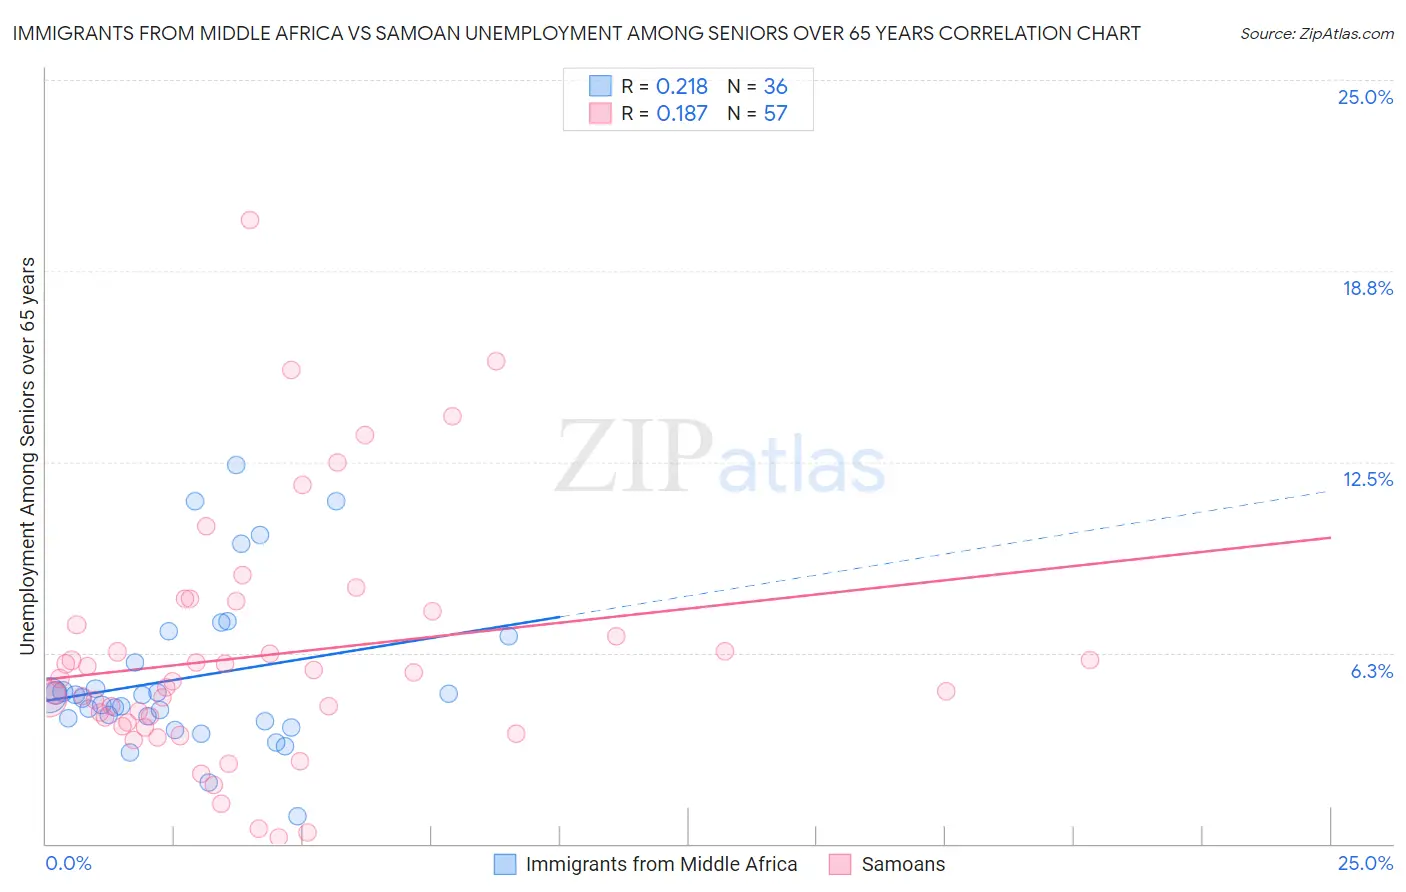
Immigrants from Middle Africa vs Samoan Unemployment Among Seniors over 65 years Correlation Chart
The statistical analysis conducted on geographies consisting of 191,389,450 people shows a weak positive correlation between the proportion of Immigrants from Middle Africa and unemployment rate amomg seniors over the age of 65 in the United States with a correlation coefficient (R) of 0.218 and weighted average of 4.9%. Similarly, the statistical analysis conducted on geographies consisting of 209,213,813 people shows a poor positive correlation between the proportion of Samoans and unemployment rate amomg seniors over the age of 65 in the United States with a correlation coefficient (R) of 0.187 and weighted average of 5.3%, a difference of 7.6%.
Unemployment Among Seniors over 65 years Correlation Summary
| Measurement | Immigrants from Middle Africa | Samoan |
| Minimum | 0.90% | 0.20% |
| Maximum | 12.4% | 20.4% |
| Range | 11.5% | 20.2% |
| Mean | 5.4% | 6.1% |
| Median | 4.8% | 5.3% |
| Interquartile 25% (IQ1) | 4.1% | 3.9% |
| Interquartile 75% (IQ3) | 6.4% | 7.4% |
| Interquartile Range (IQR) | 2.3% | 3.5% |
| Standard Deviation (Sample) | 2.6% | 3.9% |
| Standard Deviation (Population) | 2.6% | 3.9% |
Similar Demographics by Unemployment Among Seniors over 65 years
Demographics Similar to Immigrants from Middle Africa by Unemployment Among Seniors over 65 years
In terms of unemployment among seniors over 65 years, the demographic groups most similar to Immigrants from Middle Africa are Immigrants from Eastern Africa (4.9%, a difference of 0.020%), Northern European (4.9%, a difference of 0.10%), Scandinavian (4.9%, a difference of 0.27%), Danish (4.9%, a difference of 0.28%), and Latvian (4.9%, a difference of 0.28%).
| Demographics | Rating | Rank | Unemployment Among Seniors over 65 years |
| Immigrants | Sudan | 99.8 /100 | #53 | Exceptional 4.9% |
| Immigrants | Iraq | 99.8 /100 | #54 | Exceptional 4.9% |
| Europeans | 99.8 /100 | #55 | Exceptional 4.9% |
| Carpatho Rusyns | 99.8 /100 | #56 | Exceptional 4.9% |
| Danes | 99.8 /100 | #57 | Exceptional 4.9% |
| Scandinavians | 99.8 /100 | #58 | Exceptional 4.9% |
| Immigrants | Eastern Africa | 99.7 /100 | #59 | Exceptional 4.9% |
| Immigrants | Middle Africa | 99.7 /100 | #60 | Exceptional 4.9% |
| Northern Europeans | 99.7 /100 | #61 | Exceptional 4.9% |
| Latvians | 99.6 /100 | #62 | Exceptional 4.9% |
| Croatians | 99.6 /100 | #63 | Exceptional 4.9% |
| Immigrants | Cambodia | 99.6 /100 | #64 | Exceptional 4.9% |
| Immigrants | Nicaragua | 99.6 /100 | #65 | Exceptional 4.9% |
| English | 99.5 /100 | #66 | Exceptional 4.9% |
| Iroquois | 99.5 /100 | #67 | Exceptional 4.9% |
Demographics Similar to Samoans by Unemployment Among Seniors over 65 years
In terms of unemployment among seniors over 65 years, the demographic groups most similar to Samoans are Haitian (5.3%, a difference of 0.030%), Immigrants from Argentina (5.3%, a difference of 0.040%), Hungarian (5.3%, a difference of 0.070%), Hopi (5.3%, a difference of 0.15%), and French American Indian (5.3%, a difference of 0.18%).
| Demographics | Rating | Rank | Unemployment Among Seniors over 65 years |
| Israelis | 6.2 /100 | #222 | Tragic 5.3% |
| Cree | 5.8 /100 | #223 | Tragic 5.3% |
| Immigrants | Syria | 5.6 /100 | #224 | Tragic 5.3% |
| Hondurans | 5.6 /100 | #225 | Tragic 5.3% |
| Immigrants | Croatia | 5.3 /100 | #226 | Tragic 5.3% |
| French American Indians | 5.2 /100 | #227 | Tragic 5.3% |
| Haitians | 4.4 /100 | #228 | Tragic 5.3% |
| Samoans | 4.2 /100 | #229 | Tragic 5.3% |
| Immigrants | Argentina | 4.0 /100 | #230 | Tragic 5.3% |
| Hungarians | 3.9 /100 | #231 | Tragic 5.3% |
| Hopi | 3.5 /100 | #232 | Tragic 5.3% |
| Marshallese | 3.1 /100 | #233 | Tragic 5.3% |
| Blackfeet | 3.1 /100 | #234 | Tragic 5.3% |
| Immigrants | Albania | 2.7 /100 | #235 | Tragic 5.3% |
| Immigrants | Costa Rica | 2.1 /100 | #236 | Tragic 5.3% |