Immigrants from Middle Africa vs Immigrants from Australia Unemployment Among Ages 60 to 64 years

COMPARE

Immigrants from Middle Africa
Race
Ancestry
AfghanAfricanAlaska NativeAlaskan AthabascanAlbanianAleutAlsatianAmericanApacheArabArapahoArgentineanArmenianAssyrian/Chaldean/SyriacAustralianAustrianBahamianBangladeshiBarbadianBasqueBelgianBelizeanBermudanBhutaneseBlackfeetBolivianBrazilianBritishBritish West IndianBulgarianBurmeseCajunCambodianCanadianCape VerdeanCarpatho RusynCelticCentral AmericanCentral American IndianCherokeeCheyenneChickasawChileanChineseChippewaChoctawColombianColvilleComancheCosta RicanCreeCreekCroatianCrowCubanCypriotCzechCzechoslovakianDanishDelawareDominicanDutchDutch West IndianEastern EuropeanEcuadorianEgyptianEnglishEstonianEthiopianEuropeanFijianFilipinoFinnishFrenchFrench American IndianFrench CanadianGermanGerman RussianGhanaianGreekGuamanian/ChamorroGuatemalanGuyaneseHaitianHmongHonduranHopiHoumaHungarianIcelanderIndian (Asian)IndonesianInupiatIranianIraqiIrishIroquoisIsraeliItalianJamaicanJapaneseJordanianKenyanKiowaKoreanLaotianLatvianLebaneseLiberianLithuanianLumbeeLuxembourgerMacedonianMalaysianMalteseMarshalleseMenomineeMexicanMexican American IndianMongolianMoroccanNative HawaiianNavajoNepaleseNew ZealanderNicaraguanNigerianNorthern EuropeanNorwegianOkinawanOsageOttawaPaiutePakistaniPalestinianPanamanianParaguayanPennsylvania GermanPeruvianPimaPolishPortuguesePotawatomiPuebloPuerto RicanPuget Sound SalishRomanianRussianSalvadoranSamoanScandinavianScotch-IrishScottishSeminoleSenegaleseSerbianShoshoneSierra LeoneanSiouxSlavicSlovakSloveneSomaliSouth AfricanSouth AmericanSouth American IndianSoviet UnionSpaniardSpanishSpanish AmericanSpanish American IndianSri LankanSubsaharan AfricanSudaneseSwedishSwissSyrianTaiwaneseThaiTlingit-HaidaTohono O'OdhamTonganTrinidadian and TobagonianTsimshianTurkishU.S. Virgin IslanderUgandanUkrainianUruguayanUteVenezuelanVietnameseWelshWest IndianYakamaYaquiYugoslavianYumanYup'ikZimbabwean
Immigration
NonimmigrantsImmigrantsAfghanistanAfricaAlbaniaArgentinaArmeniaAsiaAustriaBahamasBangladeshBarbadosBelarusBelgiumBelizeBoliviaBosnia and HerzegovinaBrazilBulgariaBurma/MyanmarCabo VerdeCambodiaCameroonCanadaCaribbeanCentral AmericaChileChinaColombiaCongoCosta RicaCroatiaCubaCzechoslovakiaDenmarkDominicaDominican RepublicEastern AfricaEastern AsiaEastern EuropeEcuadorEgyptEl SalvadorEnglandEritreaEthiopiaEuropeFijiFranceGermanyGhanaGreeceGrenadaGuatemalaGuyanaHaitiHondurasHong KongHungaryIndiaIndonesiaIranIraqIrelandIsraelItalyJamaicaJapanJordanKazakhstanKenyaKoreaKuwaitLaosLatin AmericaLatviaLebanonLiberiaLithuaniaMalaysiaMexicoMicronesiaMiddle AfricaMoldovaMoroccoNepalNetherlandsNicaraguaNigeriaNorth AmericaNorth MacedoniaNorthern AfricaNorthern EuropeNorwayOceaniaPakistanPanamaPeruPhilippinesPolandPortugalRomaniaRussiaSaudi ArabiaScotlandSenegalSerbiaSierra LeoneSingaporeSomaliaSouth AfricaSouth AmericaSouth Central AsiaSouth Eastern AsiaSouthern EuropeSpainSri LankaSt. Vincent and the GrenadinesSudanSwedenSwitzerlandSyriaTaiwanThailandTrinidad and TobagoTurkeyUgandaUkraineUruguayUzbekistanVenezuelaVietnamWest IndiesWestern AfricaWestern AsiaWestern EuropeYemenZaireZimbabweAzores
Immigrants from Australia
Race
Ancestry
AfghanAfricanAlaska NativeAlaskan AthabascanAlbanianAleutAlsatianAmericanApacheArabArapahoArgentineanArmenianAssyrian/Chaldean/SyriacAustralianAustrianBahamianBangladeshiBarbadianBasqueBelgianBelizeanBermudanBhutaneseBlackfeetBolivianBrazilianBritishBritish West IndianBulgarianBurmeseCajunCambodianCanadianCape VerdeanCarpatho RusynCelticCentral AmericanCentral American IndianCherokeeCheyenneChickasawChileanChineseChippewaChoctawColombianColvilleComancheCosta RicanCreeCreekCroatianCrowCubanCypriotCzechCzechoslovakianDanishDelawareDominicanDutchDutch West IndianEastern EuropeanEcuadorianEgyptianEnglishEstonianEthiopianEuropeanFijianFilipinoFinnishFrenchFrench American IndianFrench CanadianGermanGerman RussianGhanaianGreekGuamanian/ChamorroGuatemalanGuyaneseHaitianHmongHonduranHopiHoumaHungarianIcelanderIndian (Asian)IndonesianInupiatIranianIraqiIrishIroquoisIsraeliItalianJamaicanJapaneseJordanianKenyanKiowaKoreanLaotianLatvianLebaneseLiberianLithuanianLumbeeLuxembourgerMacedonianMalaysianMalteseMarshalleseMenomineeMexicanMexican American IndianMongolianMoroccanNative HawaiianNavajoNepaleseNew ZealanderNicaraguanNigerianNorthern EuropeanNorwegianOkinawanOsageOttawaPaiutePakistaniPalestinianPanamanianParaguayanPennsylvania GermanPeruvianPimaPolishPortuguesePotawatomiPuebloPuerto RicanPuget Sound SalishRomanianRussianSalvadoranSamoanScandinavianScotch-IrishScottishSeminoleSenegaleseSerbianShoshoneSierra LeoneanSiouxSlavicSlovakSloveneSomaliSouth AfricanSouth AmericanSouth American IndianSoviet UnionSpaniardSpanishSpanish AmericanSpanish American IndianSri LankanSubsaharan AfricanSudaneseSwedishSwissSyrianTaiwaneseThaiTlingit-HaidaTohono O'OdhamTonganTrinidadian and TobagonianTsimshianTurkishU.S. Virgin IslanderUgandanUkrainianUruguayanUteVenezuelanVietnameseWelshWest IndianYakamaYaquiYugoslavianYumanYup'ikZimbabwean
Immigration
NonimmigrantsImmigrantsAfghanistanAfricaAlbaniaArgentinaArmeniaAsiaAustraliaAustriaBahamasBangladeshBarbadosBelarusBelgiumBelizeBoliviaBosnia and HerzegovinaBrazilBulgariaBurma/MyanmarCabo VerdeCambodiaCameroonCanadaCaribbeanCentral AmericaChileChinaColombiaCongoCosta RicaCroatiaCubaCzechoslovakiaDenmarkDominicaDominican RepublicEastern AfricaEastern AsiaEastern EuropeEcuadorEgyptEl SalvadorEnglandEritreaEthiopiaEuropeFijiFranceGermanyGhanaGreeceGrenadaGuatemalaGuyanaHaitiHondurasHong KongHungaryIndiaIndonesiaIranIraqIrelandIsraelItalyJamaicaJapanJordanKazakhstanKenyaKoreaKuwaitLaosLatin AmericaLatviaLebanonLiberiaLithuaniaMalaysiaMexicoMicronesiaMoldovaMoroccoNepalNetherlandsNicaraguaNigeriaNorth AmericaNorth MacedoniaNorthern AfricaNorthern EuropeNorwayOceaniaPakistanPanamaPeruPhilippinesPolandPortugalRomaniaRussiaSaudi ArabiaScotlandSenegalSerbiaSierra LeoneSingaporeSomaliaSouth AfricaSouth AmericaSouth Central AsiaSouth Eastern AsiaSouthern EuropeSpainSri LankaSt. Vincent and the GrenadinesSudanSwedenSwitzerlandSyriaTaiwanThailandTrinidad and TobagoTurkeyUgandaUkraineUruguayUzbekistanVenezuelaVietnamWest IndiesWestern AfricaWestern AsiaWestern EuropeYemenZaireZimbabweAzores
Unemployment Among Ages 60 to 64 years
Income
Poverty
Unemployment
Labor Participation
Family Structure
Vehicle Availability
Education Level
Disability

Unemployment Among Ages 60 to 64 years Comparison

Immigrants from Middle Africa

Immigrants from Australia

Exceptional
Tragic
4.6%
UNEMPLOYMENT AMONG AGES 60 TO 64 YEARS
99.7/ 100
METRIC RATING
64th/ 347
METRIC RANK
5.1%
UNEMPLOYMENT AMONG AGES 60 TO 64 YEARS
0.2/ 100
METRIC RATING
266th/ 347
METRIC RANK

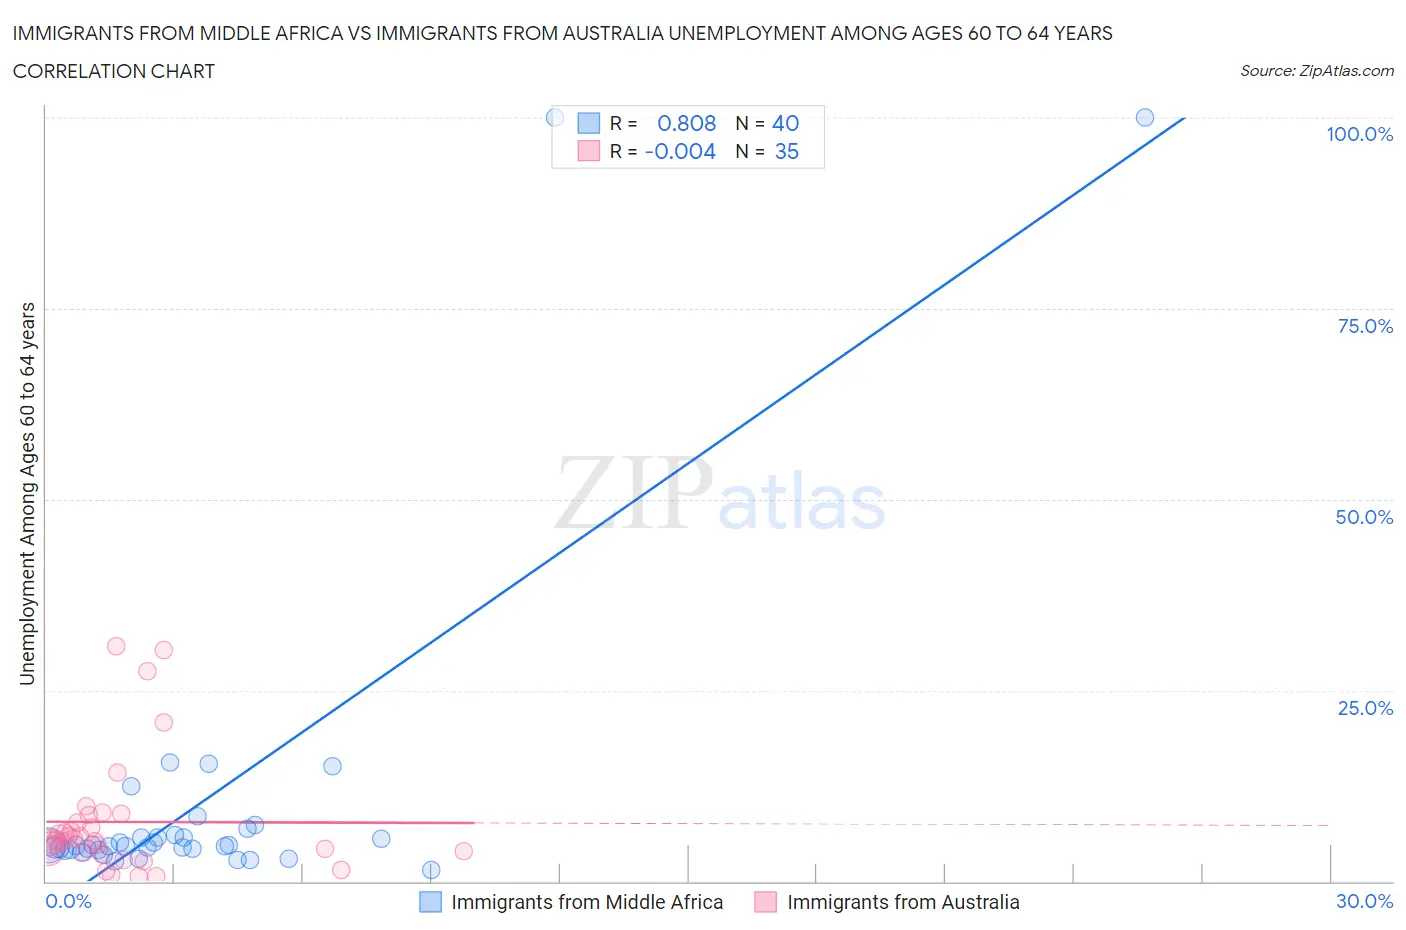
Immigrants from Middle Africa vs Immigrants from Australia Unemployment Among Ages 60 to 64 years Correlation Chart

The statistical analysis conducted on geographies consisting of 191,643,195 people shows a very strong positive correlation between the proportion of Immigrants from Middle Africa and unemployment rate among population between the ages 60 and 64 in the United States with a correlation coefficient (R) of 0.808 and weighted average of 4.6%. Similarly, the statistical analysis conducted on geographies consisting of 213,891,110 people shows no correlation between the proportion of Immigrants from Australia and unemployment rate among population between the ages 60 and 64 in the United States with a correlation coefficient (R) of -0.004 and weighted average of 5.1%, a difference of 11.1%.
Immigrants from Middle Africa vs Immigrants from Australia Unemployment Among Ages 60 to 64 years

Unemployment Among Ages 60 to 64 years Correlation Summary

MeasurementImmigrants from Middle AfricaImmigrants from Australia
Minimum1.4%0.70%
Maximum100.0%30.8%
Range98.6%30.1%
Mean10.3%7.8%
Median4.7%5.3%
Interquartile 25% (IQ1)4.1%3.8%
Interquartile 75% (IQ3)5.8%8.7%
Interquartile Range (IQR)1.7%4.9%
Standard Deviation (Sample)21.1%7.8%
Standard Deviation (Population)20.8%7.7%

Similar Demographics by Unemployment Among Ages 60 to 64 years

Demographics Similar to Immigrants from Middle Africa by Unemployment Among Ages 60 to 64 years

In terms of unemployment among ages 60 to 64 years, the demographic groups most similar to Immigrants from Middle Africa are Czechoslovakian (4.6%, a difference of 0.020%), Jordanian (4.6%, a difference of 0.020%), Senegalese (4.6%, a difference of 0.050%), Lebanese (4.6%, a difference of 0.15%), and Hawaiian (4.6%, a difference of 0.23%).
DemographicsRating | RankUnemployment Among Ages 60 to 64 years
British
99.9
/100
|
#57
Exceptional
4.6%
Immigrants | India
99.8
/100
|
#58
Exceptional
4.6%
Swiss
99.8
/100
|
#59
Exceptional
4.6%
Puget Sound Salish
99.8
/100
|
#60
Exceptional
4.6%
Lebanese
99.8
/100
|
#61
Exceptional
4.6%
Senegalese
99.7
/100
|
#62
Exceptional
4.6%
Czechoslovakians
99.7
/100
|
#63
Exceptional
4.6%
Immigrants | Middle Africa
99.7
/100
|
#64
Exceptional
4.6%
Jordanians
99.7
/100
|
#65
Exceptional
4.6%
Hawaiians
99.6
/100
|
#66
Exceptional
4.6%
Immigrants | Scotland
99.6
/100
|
#67
Exceptional
4.6%
Immigrants | Laos
99.6
/100
|
#68
Exceptional
4.6%
Creek
99.6
/100
|
#69
Exceptional
4.6%
Croatians
99.5
/100
|
#70
Exceptional
4.6%
Slavs
99.5
/100
|
#71
Exceptional
4.6%

Demographics Similar to Immigrants from Australia by Unemployment Among Ages 60 to 64 years

In terms of unemployment among ages 60 to 64 years, the demographic groups most similar to Immigrants from Australia are Immigrants from Argentina (5.1%, a difference of 0.020%), Immigrants from Bahamas (5.1%, a difference of 0.050%), Central American Indian (5.1%, a difference of 0.22%), Immigrants from Costa Rica (5.1%, a difference of 0.25%), and Sioux (5.1%, a difference of 0.36%).
DemographicsRating | RankUnemployment Among Ages 60 to 64 years
Hondurans
0.5
/100
|
#259
Tragic
5.1%
Immigrants | Honduras
0.4
/100
|
#260
Tragic
5.1%
Immigrants | Ghana
0.4
/100
|
#261
Tragic
5.1%
Immigrants | Uzbekistan
0.4
/100
|
#262
Tragic
5.1%
Immigrants | Immigrants
0.4
/100
|
#263
Tragic
5.1%
Sioux
0.3
/100
|
#264
Tragic
5.1%
Immigrants | Argentina
0.2
/100
|
#265
Tragic
5.1%
Immigrants | Australia
0.2
/100
|
#266
Tragic
5.1%
Immigrants | Bahamas
0.2
/100
|
#267
Tragic
5.1%
Central American Indians
0.2
/100
|
#268
Tragic
5.1%
Immigrants | Costa Rica
0.2
/100
|
#269
Tragic
5.1%
Immigrants | Iran
0.1
/100
|
#270
Tragic
5.1%
Israelis
0.1
/100
|
#271
Tragic
5.2%
Haitians
0.1
/100
|
#272
Tragic
5.2%
Immigrants | Spain
0.1
/100
|
#273
Tragic
5.2%