Immigrants from Micronesia vs Greek Unemployment Among Ages 25 to 29 years
COMPARE
Immigrants from Micronesia
Greek
Unemployment Among Ages 25 to 29 years
Unemployment Among Ages 25 to 29 years Comparison
Immigrants from Micronesia
Greeks
6.6%
UNEMPLOYMENT AMONG AGES 25 TO 29 YEARS
71.5/ 100
METRIC RATING
144th/ 347
METRIC RANK
6.6%
UNEMPLOYMENT AMONG AGES 25 TO 29 YEARS
58.5/ 100
METRIC RATING
164th/ 347
METRIC RANK
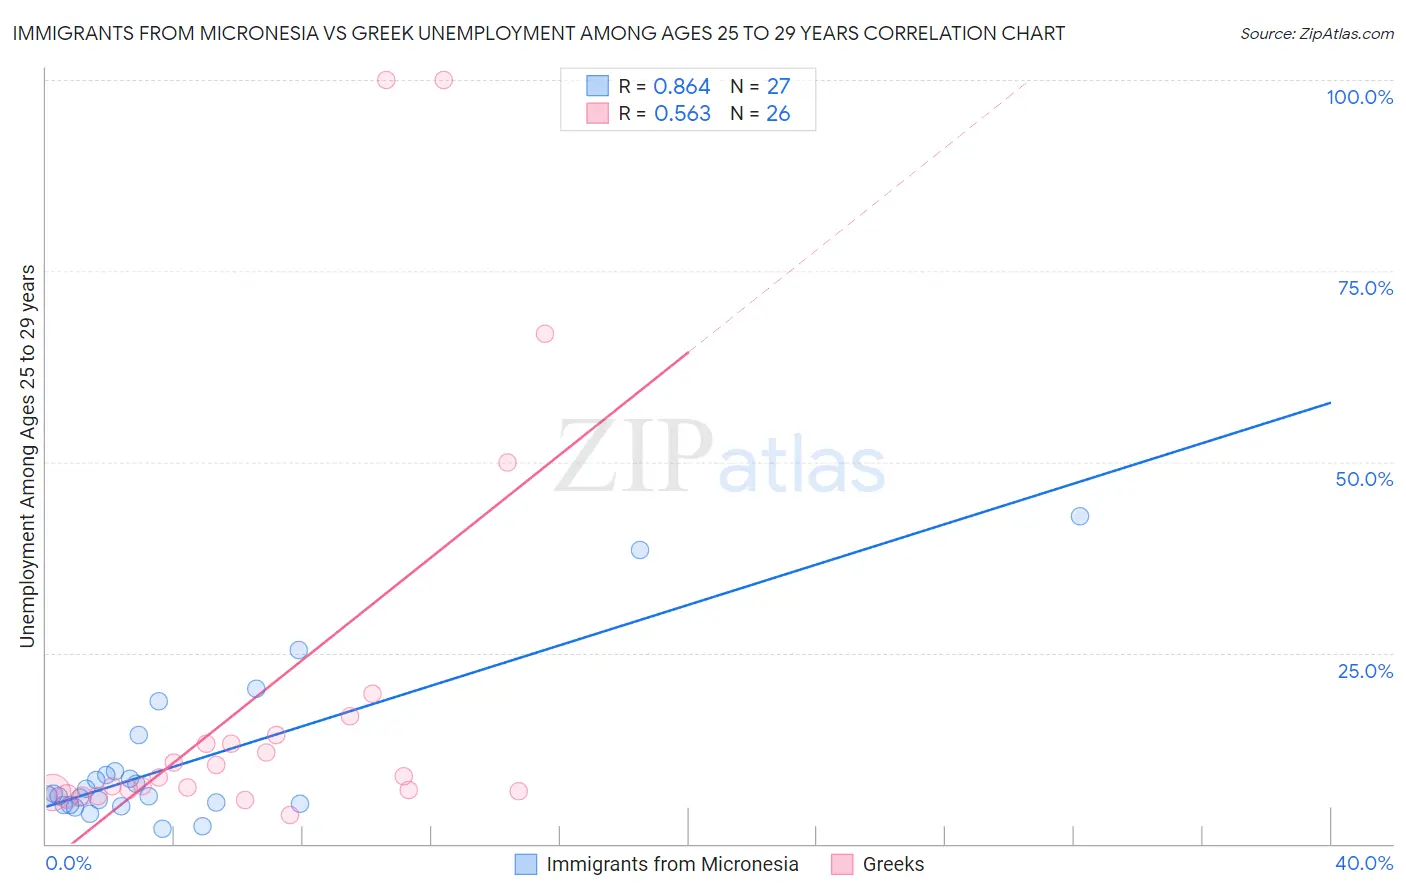
Immigrants from Micronesia vs Greek Unemployment Among Ages 25 to 29 years Correlation Chart
The statistical analysis conducted on geographies consisting of 61,003,486 people shows a very strong positive correlation between the proportion of Immigrants from Micronesia and unemployment rate among population between the ages 25 and 29 in the United States with a correlation coefficient (R) of 0.864 and weighted average of 6.6%. Similarly, the statistical analysis conducted on geographies consisting of 447,364,471 people shows a substantial positive correlation between the proportion of Greeks and unemployment rate among population between the ages 25 and 29 in the United States with a correlation coefficient (R) of 0.563 and weighted average of 6.6%, a difference of 0.91%.
Unemployment Among Ages 25 to 29 years Correlation Summary
| Measurement | Immigrants from Micronesia | Greek |
| Minimum | 2.0% | 3.8% |
| Maximum | 42.9% | 100.0% |
| Range | 40.9% | 96.2% |
| Mean | 10.6% | 20.1% |
| Median | 6.3% | 8.7% |
| Interquartile 25% (IQ1) | 5.2% | 6.8% |
| Interquartile 75% (IQ3) | 9.6% | 14.2% |
| Interquartile Range (IQR) | 4.4% | 7.4% |
| Standard Deviation (Sample) | 10.2% | 27.4% |
| Standard Deviation (Population) | 10.1% | 26.8% |
Demographics Similar to Immigrants from Micronesia and Greeks by Unemployment Among Ages 25 to 29 years
In terms of unemployment among ages 25 to 29 years, the demographic groups most similar to Immigrants from Micronesia are Nicaraguan (6.6%, a difference of 0.10%), Romanian (6.6%, a difference of 0.16%), Immigrants from Thailand (6.6%, a difference of 0.23%), Peruvian (6.6%, a difference of 0.26%), and Malaysian (6.6%, a difference of 0.33%). Similarly, the demographic groups most similar to Greeks are Immigrants from Middle Africa (6.6%, a difference of 0.060%), Immigrants from Czechoslovakia (6.6%, a difference of 0.11%), Paraguayan (6.6%, a difference of 0.12%), Scottish (6.6%, a difference of 0.15%), and Welsh (6.6%, a difference of 0.18%).
| Demographics | Rating | Rank | Unemployment Among Ages 25 to 29 years |
| Immigrants | Micronesia | 71.5 /100 | #144 | Good 6.6% |
| Nicaraguans | 70.2 /100 | #145 | Good 6.6% |
| Romanians | 69.5 /100 | #146 | Good 6.6% |
| Immigrants | Thailand | 68.4 /100 | #147 | Good 6.6% |
| Peruvians | 68.1 /100 | #148 | Good 6.6% |
| Malaysians | 67.1 /100 | #149 | Good 6.6% |
| Finns | 66.9 /100 | #150 | Good 6.6% |
| Ukrainians | 65.5 /100 | #151 | Good 6.6% |
| Samoans | 64.6 /100 | #152 | Good 6.6% |
| Immigrants | Italy | 64.4 /100 | #153 | Good 6.6% |
| Colombians | 64.0 /100 | #154 | Good 6.6% |
| Immigrants | Latvia | 63.9 /100 | #155 | Good 6.6% |
| Immigrants | Laos | 63.5 /100 | #156 | Good 6.6% |
| South Africans | 63.5 /100 | #157 | Good 6.6% |
| Immigrants | Russia | 61.5 /100 | #158 | Good 6.6% |
| Welsh | 61.3 /100 | #159 | Good 6.6% |
| Scottish | 60.7 /100 | #160 | Good 6.6% |
| Paraguayans | 60.4 /100 | #161 | Good 6.6% |
| Immigrants | Czechoslovakia | 60.2 /100 | #162 | Good 6.6% |
| Immigrants | Middle Africa | 59.4 /100 | #163 | Average 6.6% |
| Greeks | 58.5 /100 | #164 | Average 6.6% |