Immigrants from Micronesia vs Eastern European Unemployment Among Ages 65 to 74 years
COMPARE
Immigrants from Micronesia
Eastern European
Unemployment Among Ages 65 to 74 years
Unemployment Among Ages 65 to 74 years Comparison
Immigrants from Micronesia
Eastern Europeans
5.6%
UNEMPLOYMENT AMONG AGES 65 TO 74 YEARS
0.9/ 100
METRIC RATING
244th/ 347
METRIC RANK
5.3%
UNEMPLOYMENT AMONG AGES 65 TO 74 YEARS
85.6/ 100
METRIC RATING
130th/ 347
METRIC RANK
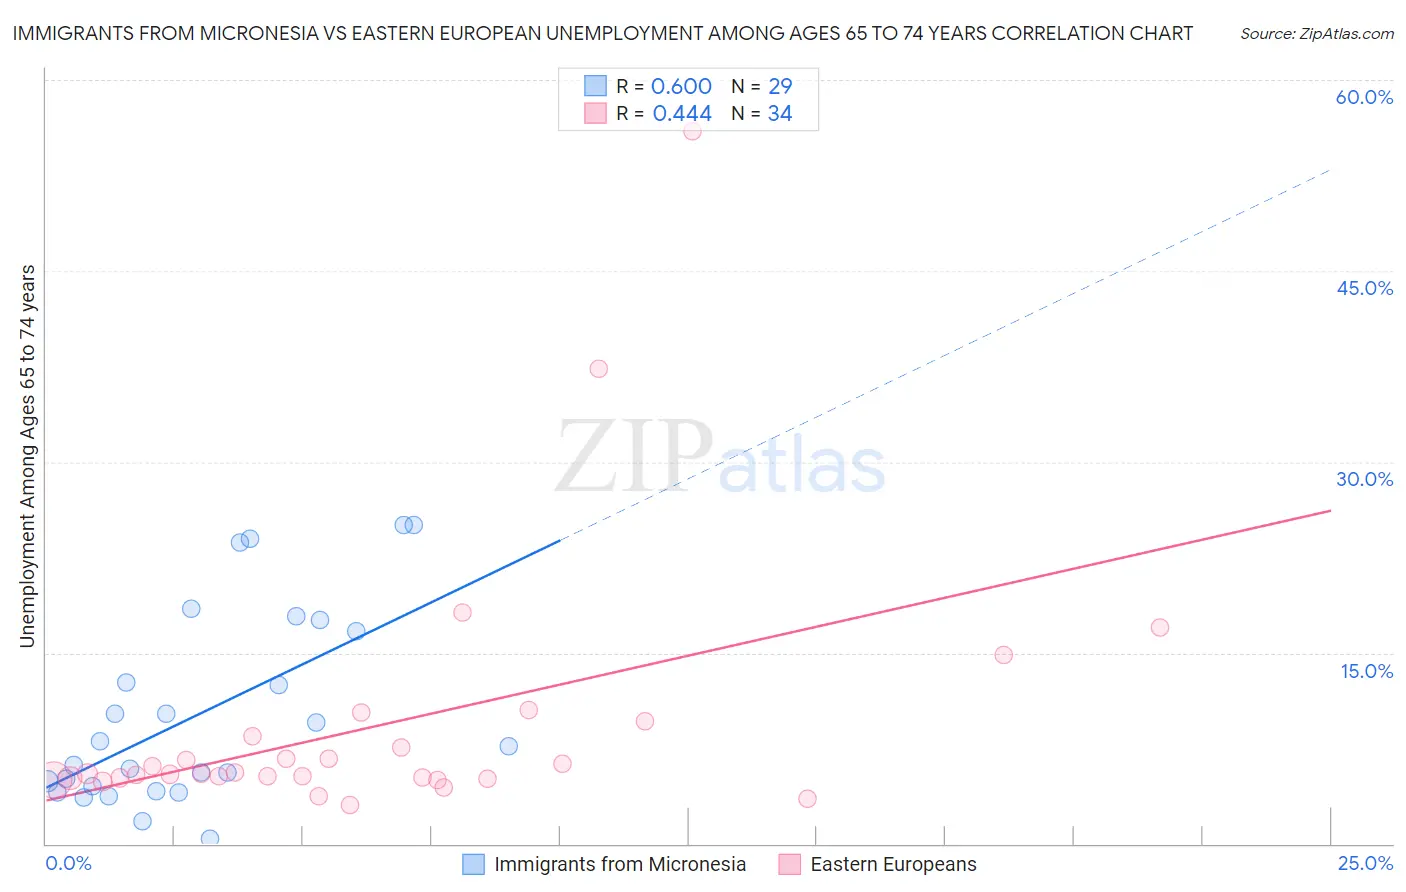
Immigrants from Micronesia vs Eastern European Unemployment Among Ages 65 to 74 years Correlation Chart
The statistical analysis conducted on geographies consisting of 58,028,119 people shows a significant positive correlation between the proportion of Immigrants from Micronesia and unemployment rate among population between the ages 65 and 74 in the United States with a correlation coefficient (R) of 0.600 and weighted average of 5.6%. Similarly, the statistical analysis conducted on geographies consisting of 390,027,608 people shows a moderate positive correlation between the proportion of Eastern Europeans and unemployment rate among population between the ages 65 and 74 in the United States with a correlation coefficient (R) of 0.444 and weighted average of 5.3%, a difference of 5.5%.
Unemployment Among Ages 65 to 74 years Correlation Summary
| Measurement | Immigrants from Micronesia | Eastern European |
| Minimum | 0.40% | 3.1% |
| Maximum | 25.0% | 56.0% |
| Range | 24.6% | 52.9% |
| Mean | 10.3% | 9.3% |
| Median | 7.7% | 5.5% |
| Interquartile 25% (IQ1) | 4.3% | 5.2% |
| Interquartile 75% (IQ3) | 17.1% | 8.5% |
| Interquartile Range (IQR) | 12.8% | 3.3% |
| Standard Deviation (Sample) | 7.5% | 10.4% |
| Standard Deviation (Population) | 7.4% | 10.2% |
Similar Demographics by Unemployment Among Ages 65 to 74 years
Demographics Similar to Immigrants from Micronesia by Unemployment Among Ages 65 to 74 years
In terms of unemployment among ages 65 to 74 years, the demographic groups most similar to Immigrants from Micronesia are Immigrants from Greece (5.6%, a difference of 0.0%), Paraguayan (5.6%, a difference of 0.010%), Immigrants (5.6%, a difference of 0.060%), Immigrants from Argentina (5.6%, a difference of 0.060%), and Trinidadian and Tobagonian (5.6%, a difference of 0.13%).
| Demographics | Rating | Rank | Unemployment Among Ages 65 to 74 years |
| Immigrants | Belize | 2.2 /100 | #237 | Tragic 5.5% |
| Cajuns | 1.8 /100 | #238 | Tragic 5.5% |
| German Russians | 1.6 /100 | #239 | Tragic 5.5% |
| Ghanaians | 1.4 /100 | #240 | Tragic 5.6% |
| Cree | 1.4 /100 | #241 | Tragic 5.6% |
| Immigrants | Ghana | 1.4 /100 | #242 | Tragic 5.6% |
| Immigrants | Peru | 1.3 /100 | #243 | Tragic 5.6% |
| Immigrants | Micronesia | 0.9 /100 | #244 | Tragic 5.6% |
| Immigrants | Greece | 0.9 /100 | #245 | Tragic 5.6% |
| Paraguayans | 0.9 /100 | #246 | Tragic 5.6% |
| Immigrants | Immigrants | 0.9 /100 | #247 | Tragic 5.6% |
| Immigrants | Argentina | 0.9 /100 | #248 | Tragic 5.6% |
| Trinidadians and Tobagonians | 0.8 /100 | #249 | Tragic 5.6% |
| Cape Verdeans | 0.7 /100 | #250 | Tragic 5.6% |
| Brazilians | 0.5 /100 | #251 | Tragic 5.6% |
Demographics Similar to Eastern Europeans by Unemployment Among Ages 65 to 74 years
In terms of unemployment among ages 65 to 74 years, the demographic groups most similar to Eastern Europeans are Immigrants from England (5.3%, a difference of 0.040%), Immigrants from Hong Kong (5.3%, a difference of 0.070%), Immigrants from North America (5.3%, a difference of 0.080%), Immigrants from South Eastern Asia (5.3%, a difference of 0.11%), and Pakistani (5.3%, a difference of 0.13%).
| Demographics | Rating | Rank | Unemployment Among Ages 65 to 74 years |
| Czechoslovakians | 88.6 /100 | #123 | Excellent 5.3% |
| Immigrants | Ukraine | 87.5 /100 | #124 | Excellent 5.3% |
| Pakistanis | 87.5 /100 | #125 | Excellent 5.3% |
| Immigrants | South Eastern Asia | 87.2 /100 | #126 | Excellent 5.3% |
| Immigrants | North America | 86.7 /100 | #127 | Excellent 5.3% |
| Immigrants | Hong Kong | 86.5 /100 | #128 | Excellent 5.3% |
| Immigrants | England | 86.2 /100 | #129 | Excellent 5.3% |
| Eastern Europeans | 85.6 /100 | #130 | Excellent 5.3% |
| Immigrants | Russia | 83.0 /100 | #131 | Excellent 5.3% |
| Koreans | 82.6 /100 | #132 | Excellent 5.3% |
| Ukrainians | 82.0 /100 | #133 | Excellent 5.3% |
| Immigrants | Panama | 81.8 /100 | #134 | Excellent 5.3% |
| Immigrants | Serbia | 81.8 /100 | #135 | Excellent 5.3% |
| Celtics | 80.8 /100 | #136 | Excellent 5.3% |
| Immigrants | Afghanistan | 80.8 /100 | #137 | Excellent 5.3% |