Immigrants from Micronesia vs Czech Unemployment Among Ages 45 to 54 years
COMPARE
Immigrants from Micronesia
Czech
Unemployment Among Ages 45 to 54 years
Unemployment Among Ages 45 to 54 years Comparison
Immigrants from Micronesia
Czechs
4.3%
UNEMPLOYMENT AMONG AGES 45 TO 54 YEARS
97.6/ 100
METRIC RATING
81st/ 347
METRIC RANK
4.0%
UNEMPLOYMENT AMONG AGES 45 TO 54 YEARS
100.0/ 100
METRIC RATING
9th/ 347
METRIC RANK
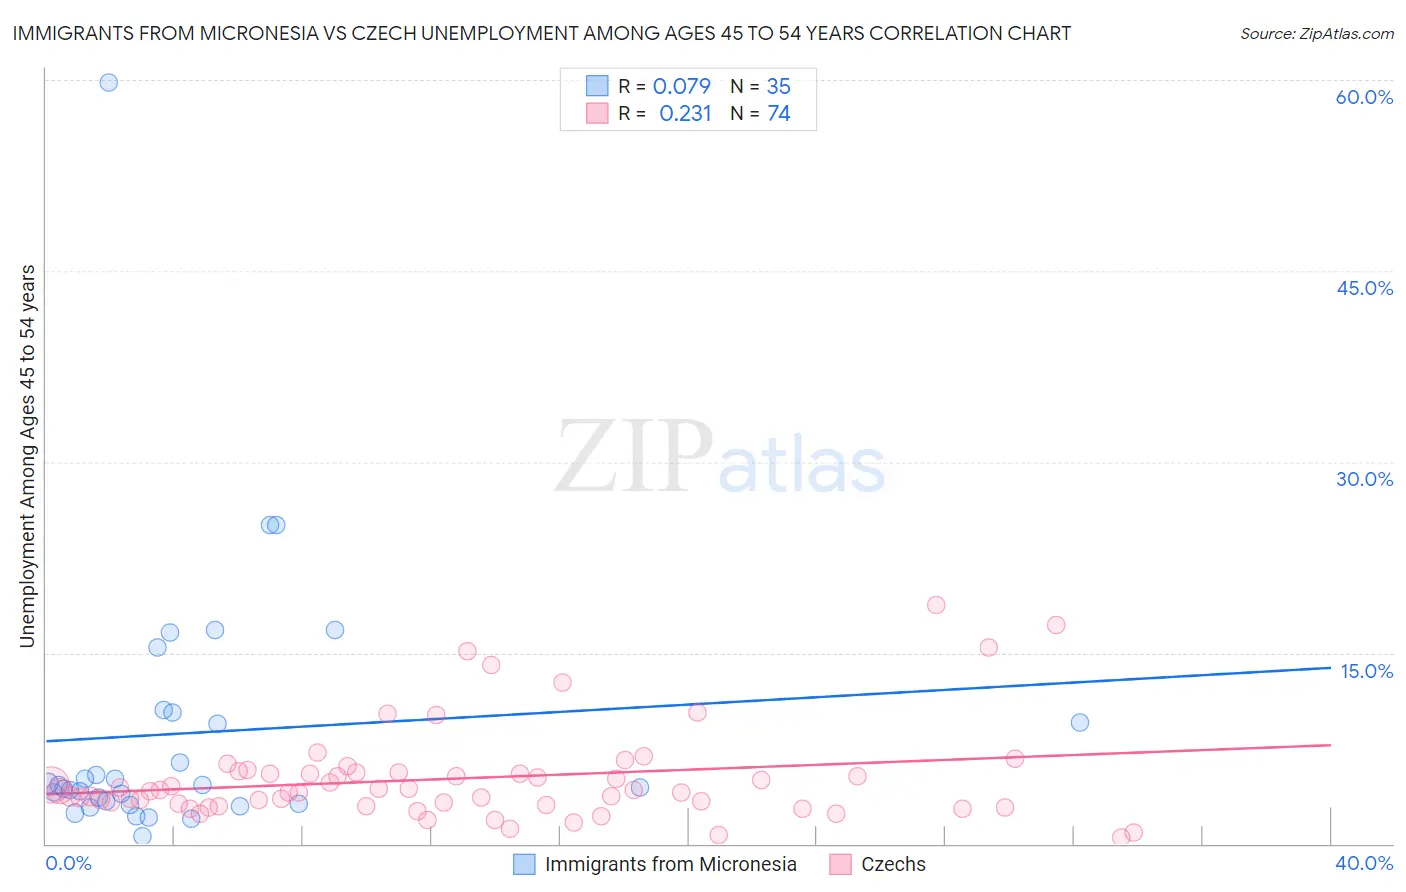
Immigrants from Micronesia vs Czech Unemployment Among Ages 45 to 54 years Correlation Chart
The statistical analysis conducted on geographies consisting of 61,070,072 people shows a slight positive correlation between the proportion of Immigrants from Micronesia and unemployment rate among population between the ages 45 and 54 in the United States with a correlation coefficient (R) of 0.079 and weighted average of 4.3%. Similarly, the statistical analysis conducted on geographies consisting of 460,605,740 people shows a weak positive correlation between the proportion of Czechs and unemployment rate among population between the ages 45 and 54 in the United States with a correlation coefficient (R) of 0.231 and weighted average of 4.0%, a difference of 9.0%.
Unemployment Among Ages 45 to 54 years Correlation Summary
| Measurement | Immigrants from Micronesia | Czech |
| Minimum | 0.60% | 0.50% |
| Maximum | 59.8% | 18.8% |
| Range | 59.2% | 18.3% |
| Mean | 8.7% | 5.1% |
| Median | 4.6% | 4.1% |
| Interquartile 25% (IQ1) | 3.1% | 3.1% |
| Interquartile 75% (IQ3) | 10.3% | 5.6% |
| Interquartile Range (IQR) | 7.2% | 2.5% |
| Standard Deviation (Sample) | 10.9% | 3.7% |
| Standard Deviation (Population) | 10.7% | 3.7% |
Similar Demographics by Unemployment Among Ages 45 to 54 years
Demographics Similar to Immigrants from Micronesia by Unemployment Among Ages 45 to 54 years
In terms of unemployment among ages 45 to 54 years, the demographic groups most similar to Immigrants from Micronesia are Eastern European (4.3%, a difference of 0.030%), Cambodian (4.3%, a difference of 0.090%), Australian (4.3%, a difference of 0.11%), German Russian (4.3%, a difference of 0.15%), and Serbian (4.3%, a difference of 0.15%).
| Demographics | Rating | Rank | Unemployment Among Ages 45 to 54 years |
| Immigrants | Belgium | 98.2 /100 | #74 | Exceptional 4.3% |
| Kenyans | 98.1 /100 | #75 | Exceptional 4.3% |
| Slavs | 98.1 /100 | #76 | Exceptional 4.3% |
| Chileans | 98.1 /100 | #77 | Exceptional 4.3% |
| German Russians | 97.9 /100 | #78 | Exceptional 4.3% |
| Serbians | 97.9 /100 | #79 | Exceptional 4.3% |
| Cambodians | 97.8 /100 | #80 | Exceptional 4.3% |
| Immigrants | Micronesia | 97.6 /100 | #81 | Exceptional 4.3% |
| Eastern Europeans | 97.6 /100 | #82 | Exceptional 4.3% |
| Australians | 97.4 /100 | #83 | Exceptional 4.3% |
| Italians | 97.3 /100 | #84 | Exceptional 4.3% |
| French | 97.3 /100 | #85 | Exceptional 4.3% |
| Ethiopians | 97.2 /100 | #86 | Exceptional 4.3% |
| Sudanese | 97.0 /100 | #87 | Exceptional 4.3% |
| Immigrants | Turkey | 96.9 /100 | #88 | Exceptional 4.3% |
Demographics Similar to Czechs by Unemployment Among Ages 45 to 54 years
In terms of unemployment among ages 45 to 54 years, the demographic groups most similar to Czechs are Chinese (4.0%, a difference of 0.16%), Immigrants from Venezuela (3.9%, a difference of 0.52%), Venezuelan (4.0%, a difference of 0.62%), Scandinavian (4.0%, a difference of 0.76%), and Swedish (4.0%, a difference of 0.78%).
| Demographics | Rating | Rank | Unemployment Among Ages 45 to 54 years |
| Fijians | 100.0 /100 | #2 | Exceptional 3.8% |
| Norwegians | 100.0 /100 | #3 | Exceptional 3.9% |
| Immigrants | India | 100.0 /100 | #4 | Exceptional 3.9% |
| Danes | 100.0 /100 | #5 | Exceptional 3.9% |
| Immigrants | Cuba | 100.0 /100 | #6 | Exceptional 3.9% |
| Immigrants | Venezuela | 100.0 /100 | #7 | Exceptional 3.9% |
| Chinese | 100.0 /100 | #8 | Exceptional 4.0% |
| Czechs | 100.0 /100 | #9 | Exceptional 4.0% |
| Venezuelans | 100.0 /100 | #10 | Exceptional 4.0% |
| Scandinavians | 100.0 /100 | #11 | Exceptional 4.0% |
| Swedes | 100.0 /100 | #12 | Exceptional 4.0% |
| Cubans | 100.0 /100 | #13 | Exceptional 4.0% |
| Immigrants | Bosnia and Herzegovina | 100.0 /100 | #14 | Exceptional 4.0% |
| Immigrants | Bolivia | 100.0 /100 | #15 | Exceptional 4.0% |
| Thais | 100.0 /100 | #16 | Exceptional 4.0% |